
INTRODUCTION
My Role &
The Background
As the Lead Product Designer, I led the design strategy and execution for the Unified Resiliency Platform (URP), a centralized solution to streamline disaster recovery, cyber resilience, and data protection for enterprises. The goal was to create a scalable, intuitive platform that empowers organizations to predict, manage, and mitigate disruptions effectively. This case study highlights the design process, key decisions, and measurable outcomes that transformed enterprise resilience operations.

PLANNING
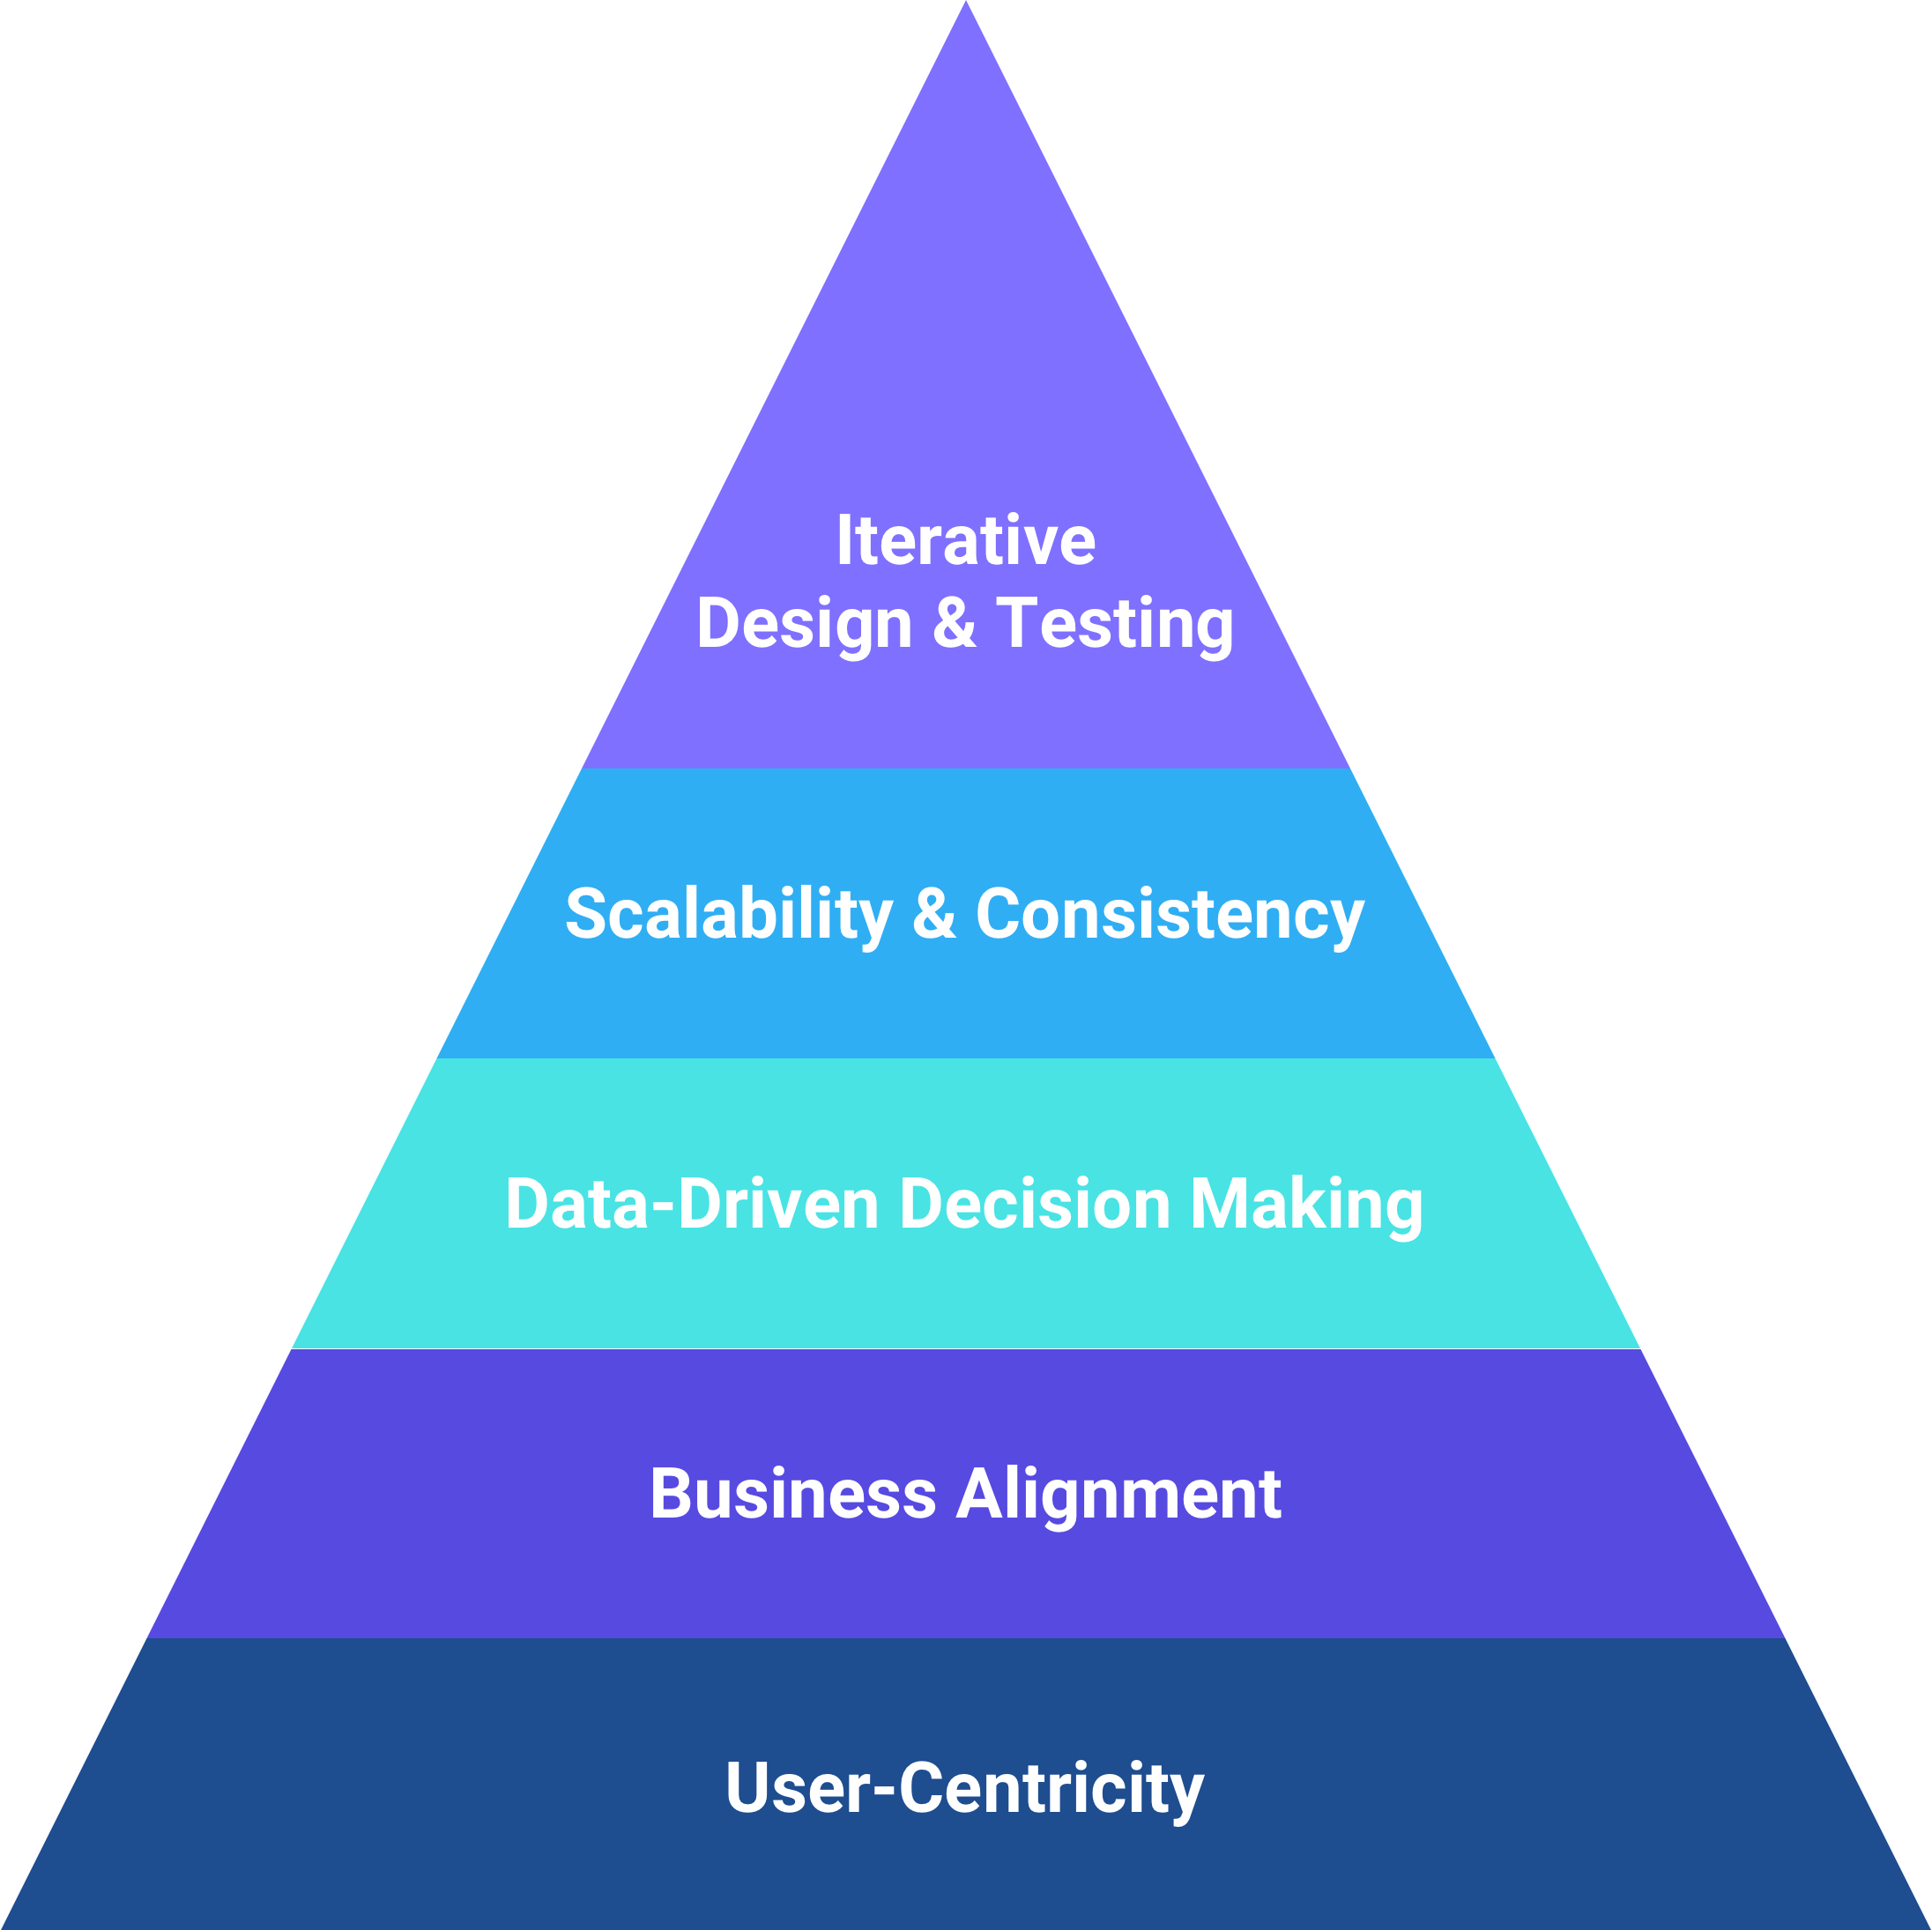
Design Strategy
The design strategy was built on a foundation of user-centricity, business alignment, and scalability, ensuring the platform met both user needs and organizational goals. The strategy included:
- User-Centricity: Deeply understanding user pain points through research and empathy.
- Scalability & Consistency: Creating a modular design system for uniformity across the platform.
- Business Alignment: Ensuring the platform supported enterprise resilience while driving cost efficiency.
- Data-Driven Decision Making: Leveraging user research, behavioral analytics, and competitive insights.
- Iterative Design & Testing: Validating designs through continuous feedback loops and usability testing.

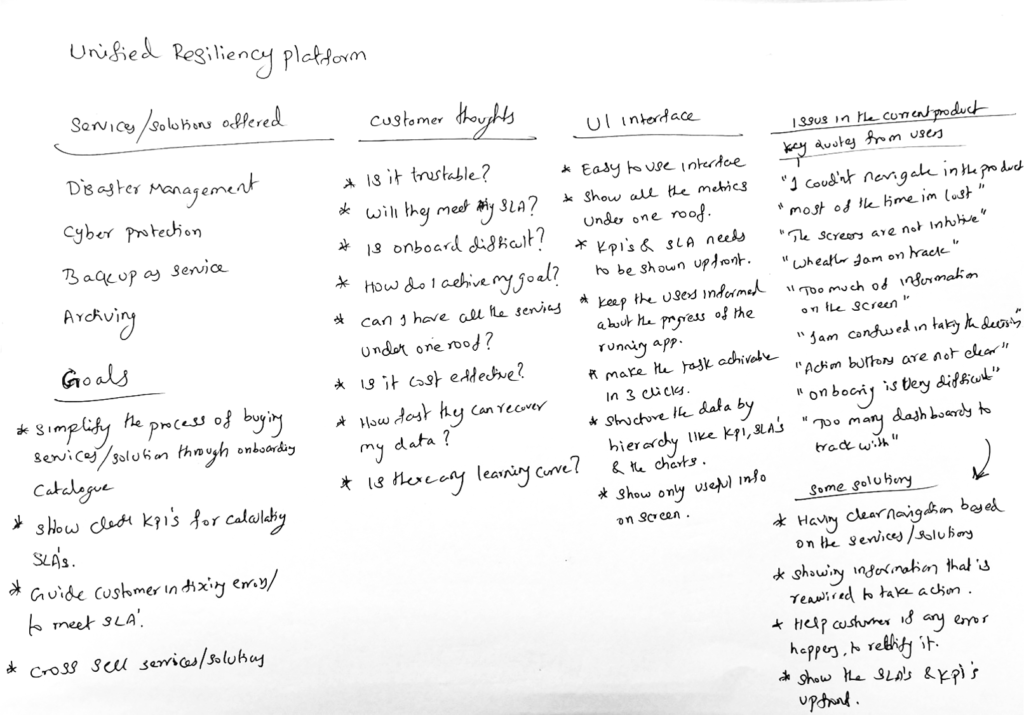
DISCOVERY PHASE
Understanding the Problem
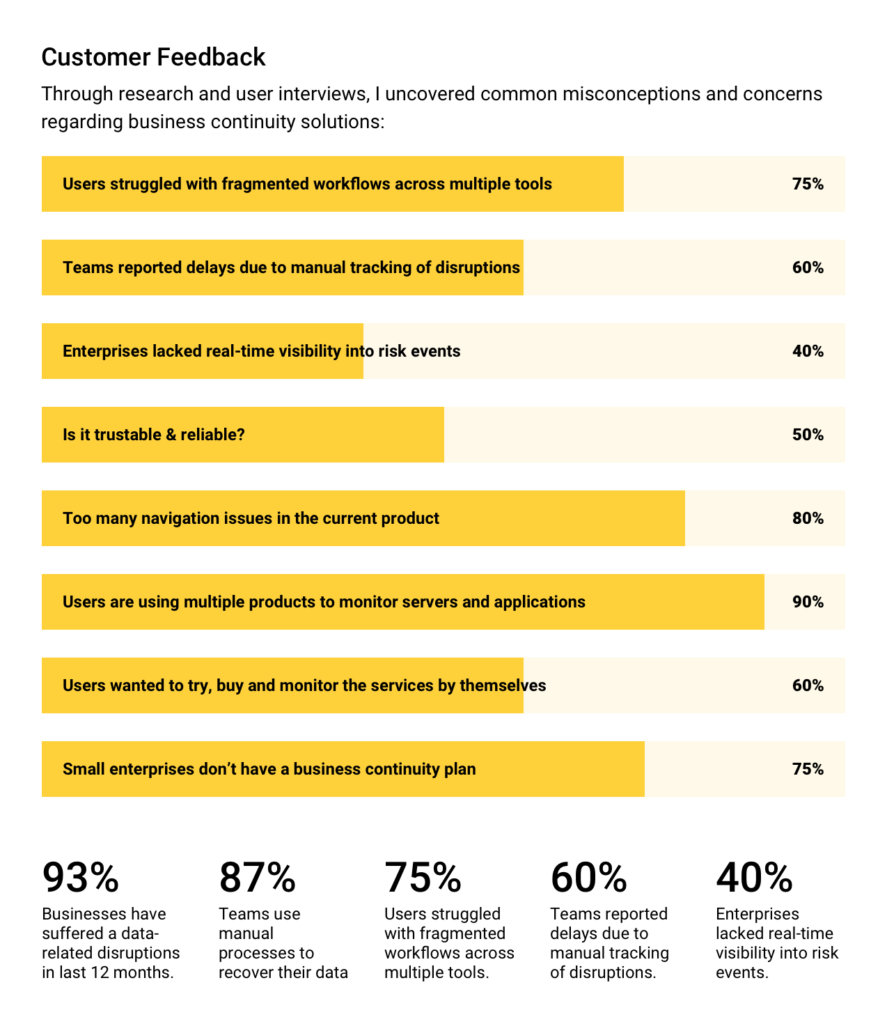
User Research & Insights:
- Conducted 25+ stakeholder interviews with risk managers, resilience officers, and security teams.
- Analyzed support tickets, surveys, and behavioral analytics to uncover pain points.
Key Findings:
- 75% of users struggled with fragmented workflows across multiple tools.
- 60% of teams reported delays due to manual tracking of disruptions.
- 40% of enterprises lacked real-time visibility into risk events.
Opportunity:
Build a centralized, AI-powered platform to automate resilience management and improve operational efficiency.
GOAL SETTING
Defining User & Business Goals
User Goals:
- Centralized visibility into resilience operations.
- Automated workflows for risk detection and response.
- Custom dashboards tailored for different user roles.
- Faster access to critical resilience insights.
Business Goals:
- Increase enterprise adoption through seamless integrations.
- Drive subscription revenue via premium automation features.
- Improve operational efficiency by reducing manual interventions.
- Establish URP as a market leader in resiliency management.

Success Metrics:
- User Adoption Rate: Target 60% increase in active users.
- Incident Resolution Time: Goal of 40% faster issue resolution.
- Workflow Automation Efficiency: Reduce manual work by 50%.
- Customer Satisfaction (CSAT): Improve to 4.5+/5.
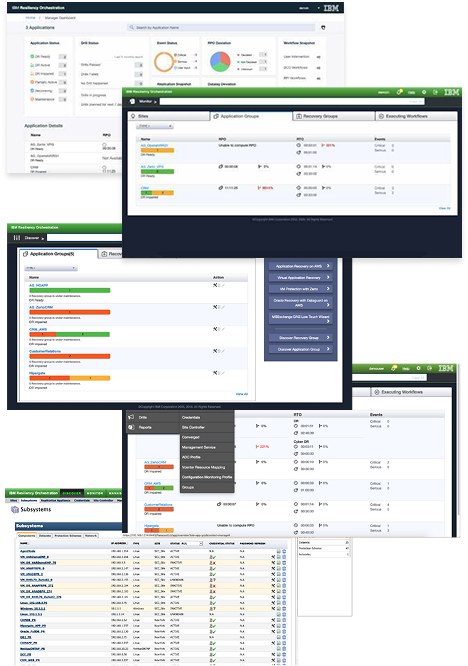
EVALUATION
Heuristic Evaluation
We ran heuristic evaluation to identify design problems in the existing user interface. We used Jakob Nielsen’s 10 usability heuristics.
- Visibility of System Status
- Match Between the System and the Real World
- User Control and Freedom
- Consistency and Standards
- Error Prevention
- Recognition Rather than Recall
- Flexibility and Efficiency of Use
- Aesthetic and Minimalist Design
- Help Users Recognize, Diagnose, and Recover from Errors
- Help and Documentation
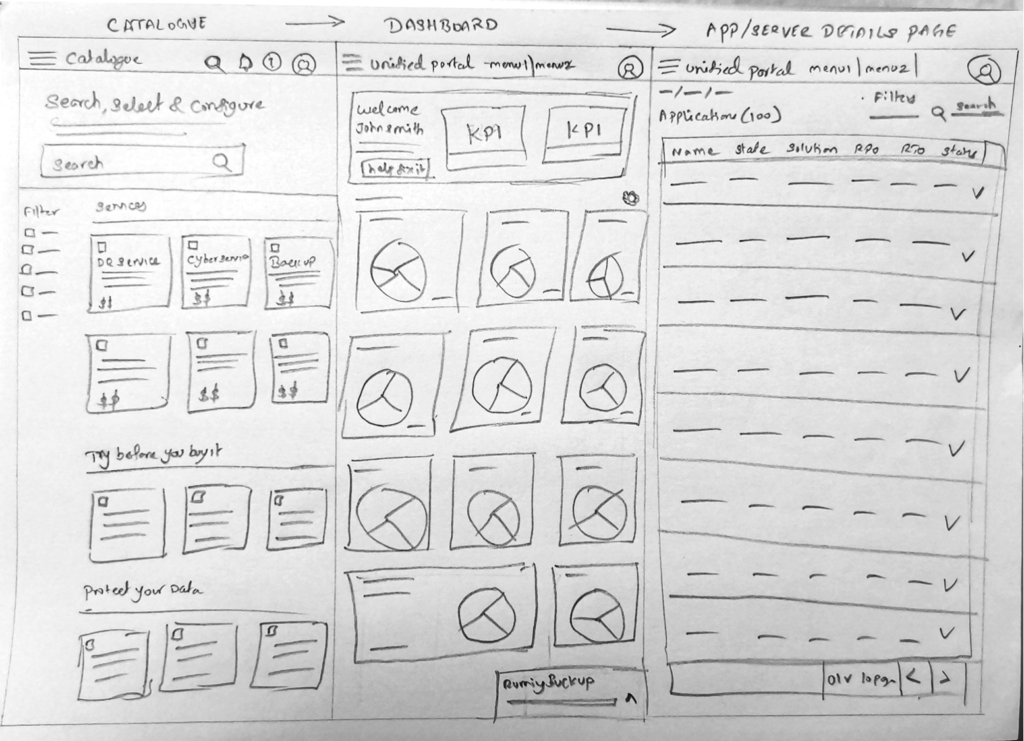
IDEATION
Ideation & Conceptualization
- Information Architecture: Restructured navigation for intuitive access and role-based dashboards.
- Wireframes & Prototypes: Developed low-fidelity wireframes and interactive prototypes for testing.
- User Flows: Mapped out efficient workflows for disaster recovery, risk assessment, and incident response.
Key Learnings from Usability Testing:
- Users preferred a timeline-based incident tracking system.
- Real-time notifications were crucial for proactive resilience.
- Customizable dashboards improved user efficiency by 35%.
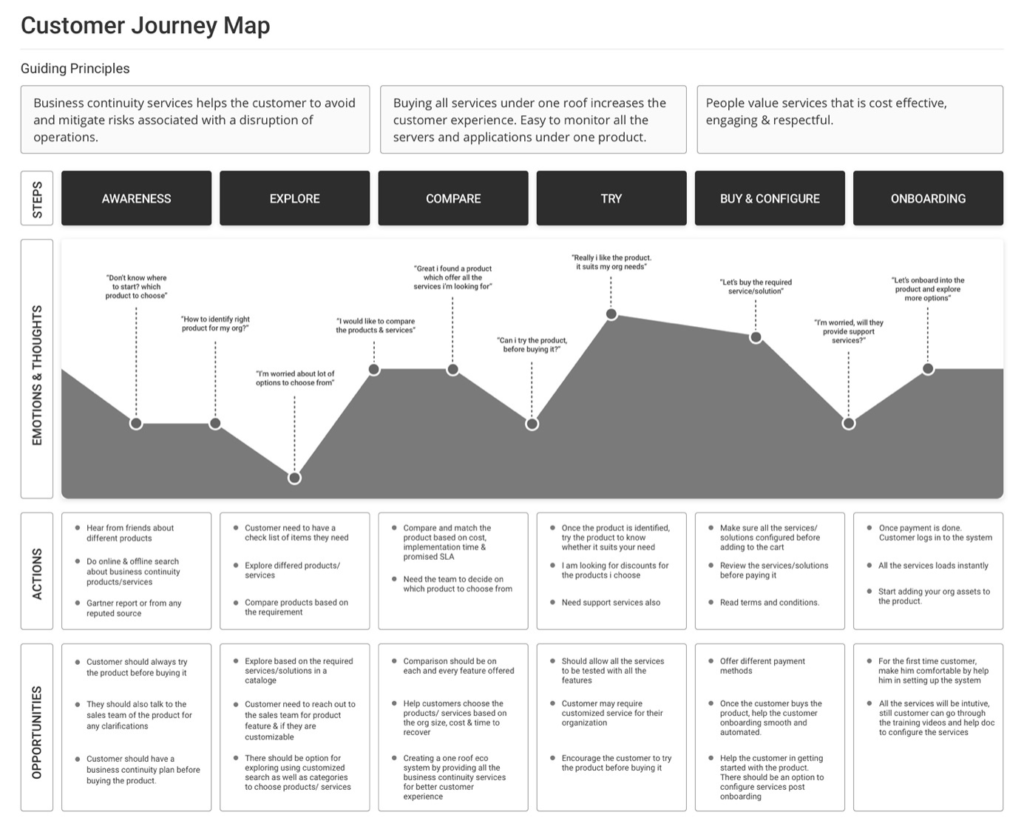
JOURNEY MAP
Customer Journey Mapping
A high-level customer journey map was developed to visualize the end-to-end experience, from initial awareness of the service to onboarding and monitoring. This helped identify critical touchpoints and pain areas in the customer’s journey.
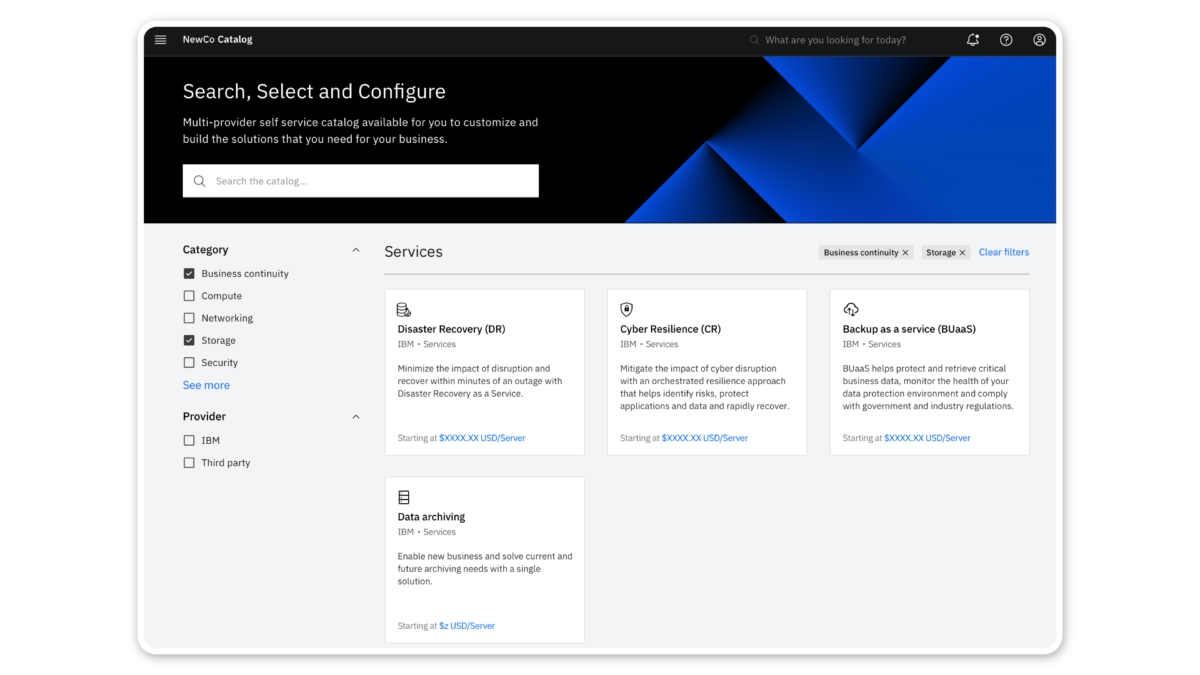
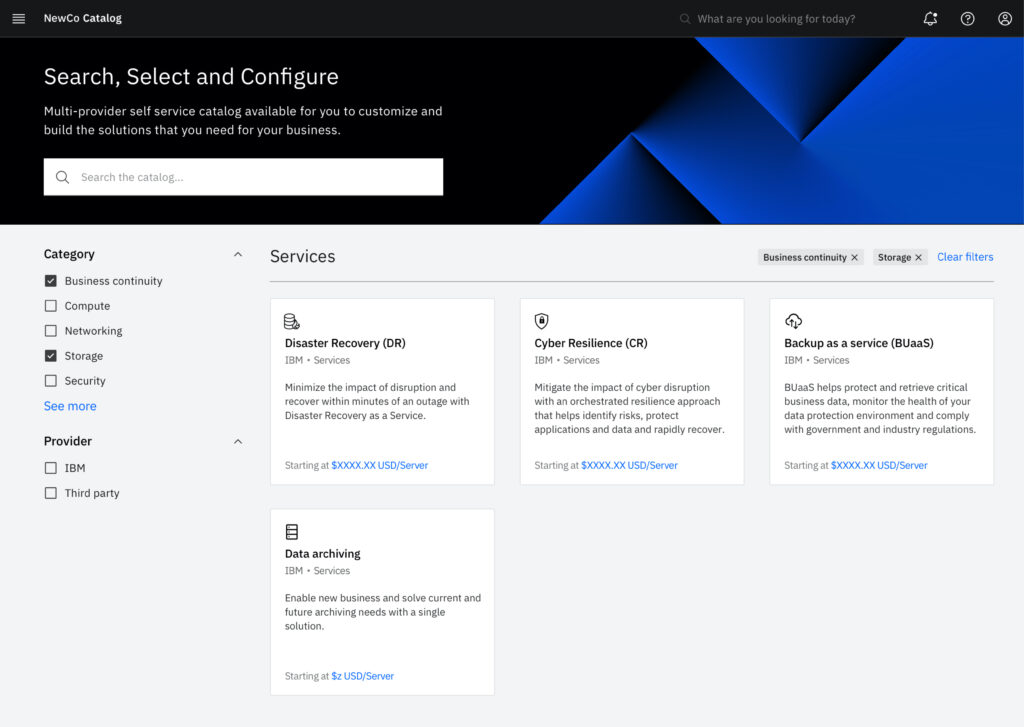
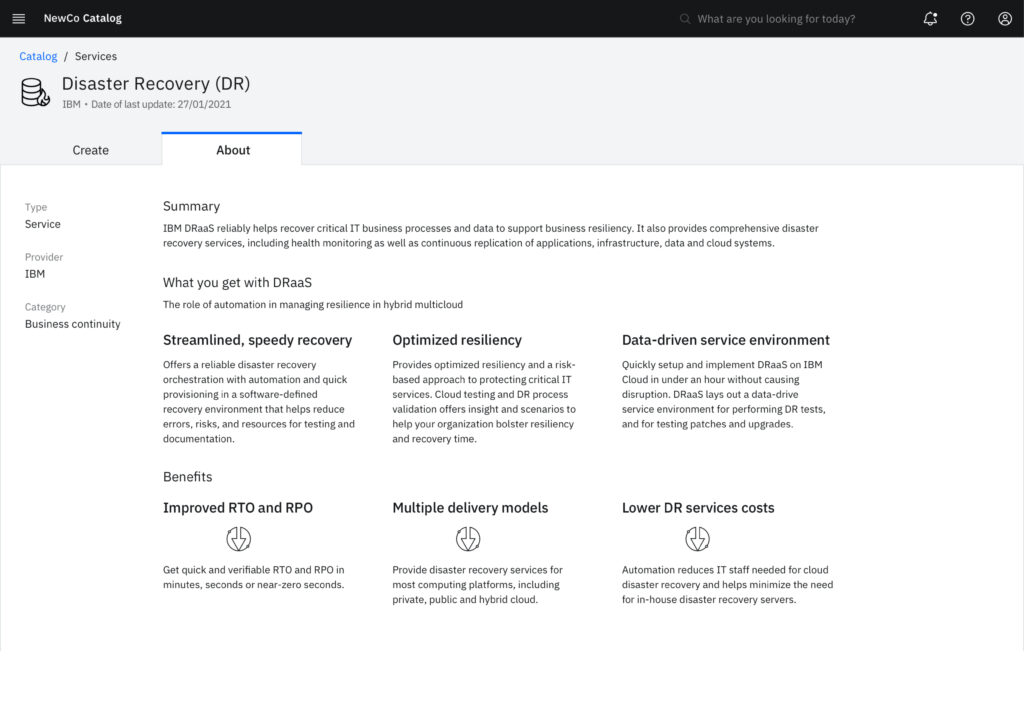
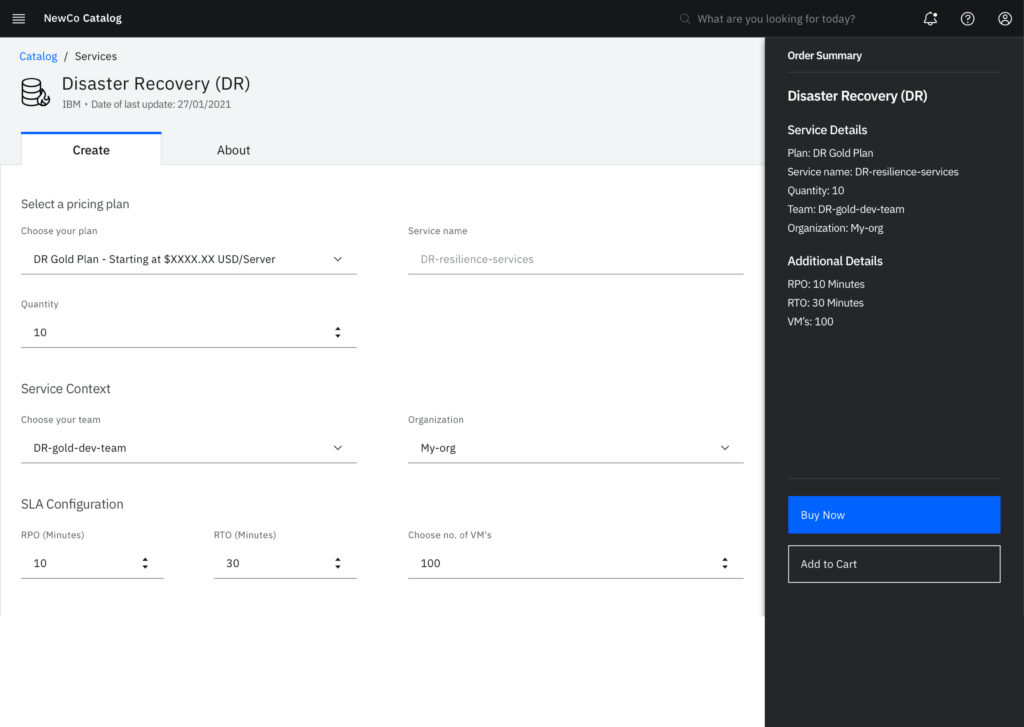
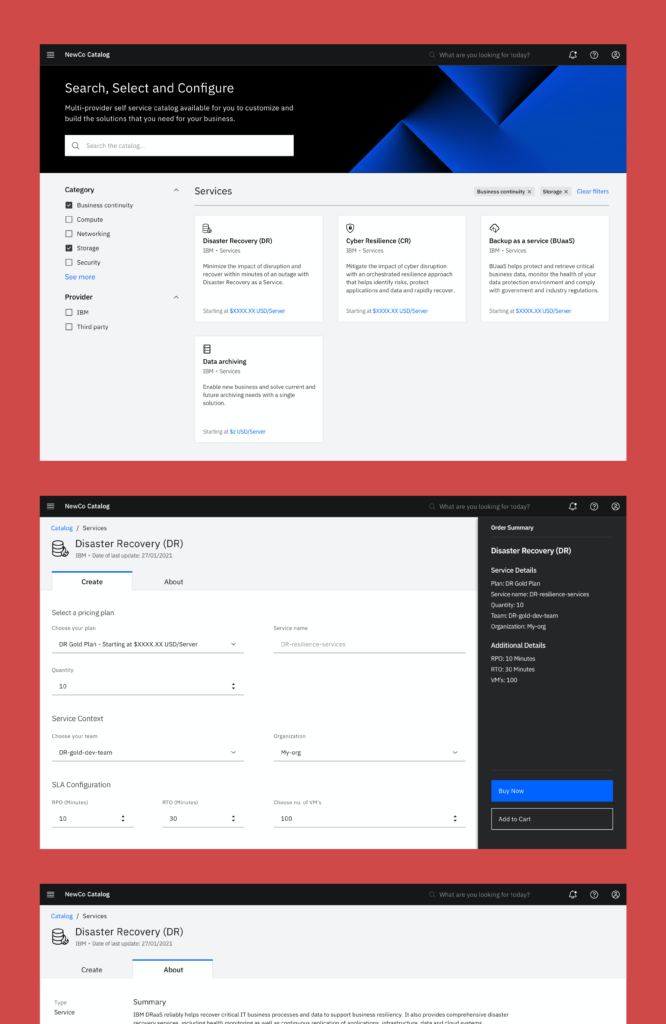
MARKETPLACE
Digital marketplace : Discover, Try and Buy Solutions
The catalogue helps the customer to choose and customize services/solutions that they need for their business.
This helps us in achieving goal
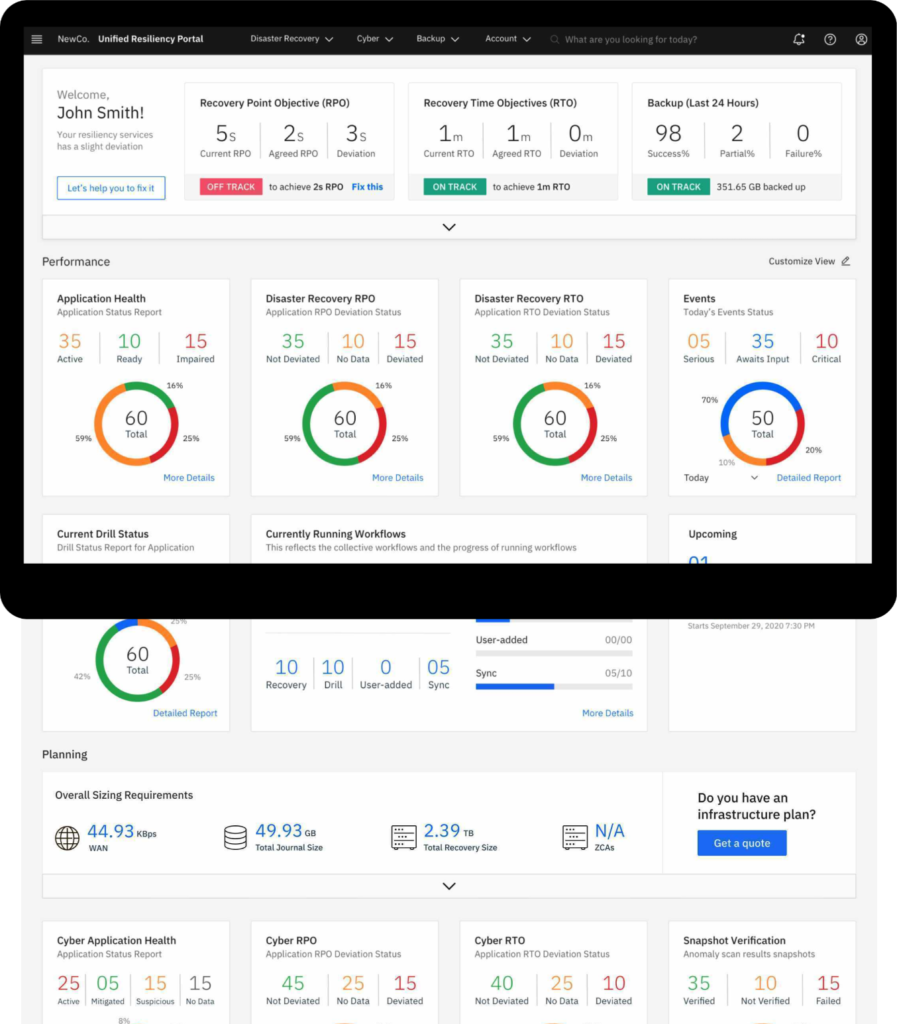
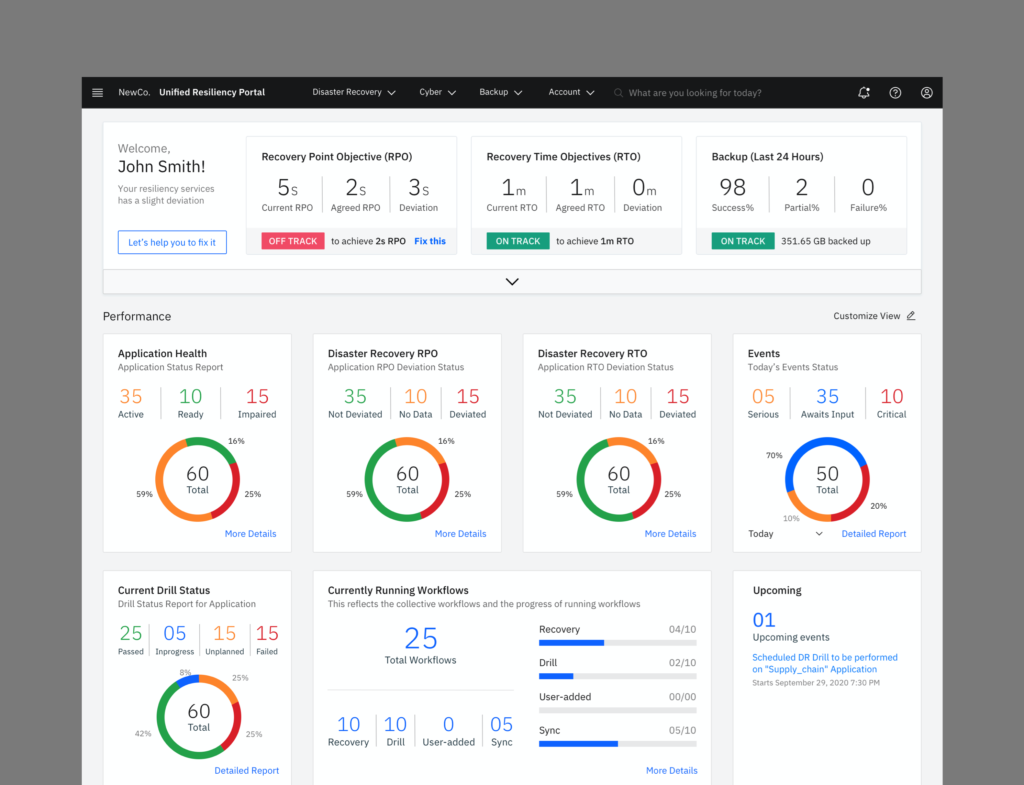
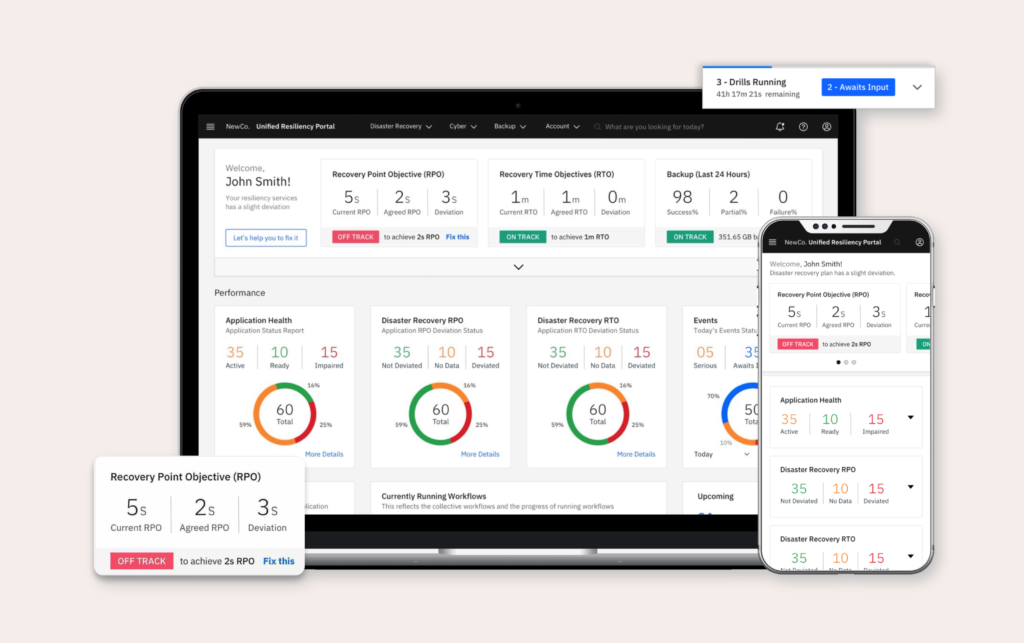
UNIFIED DASHBOARD
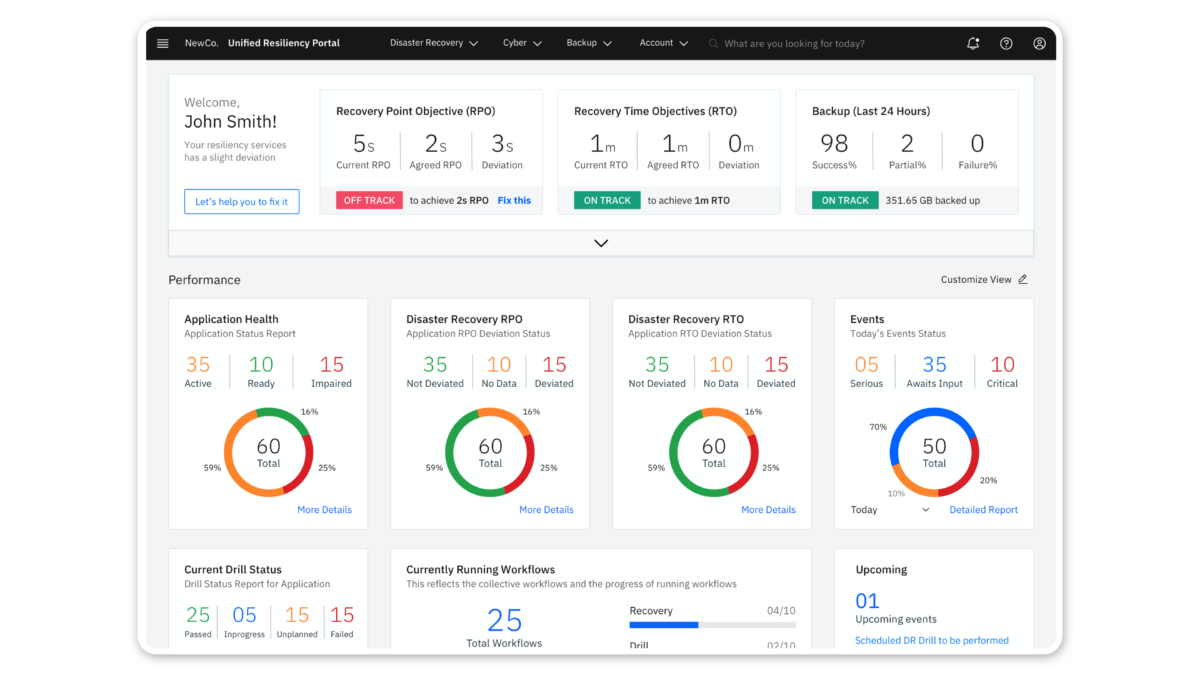
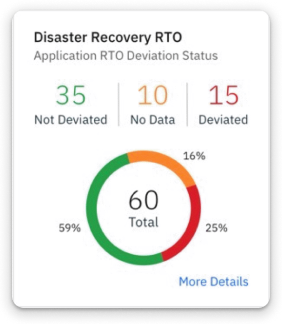
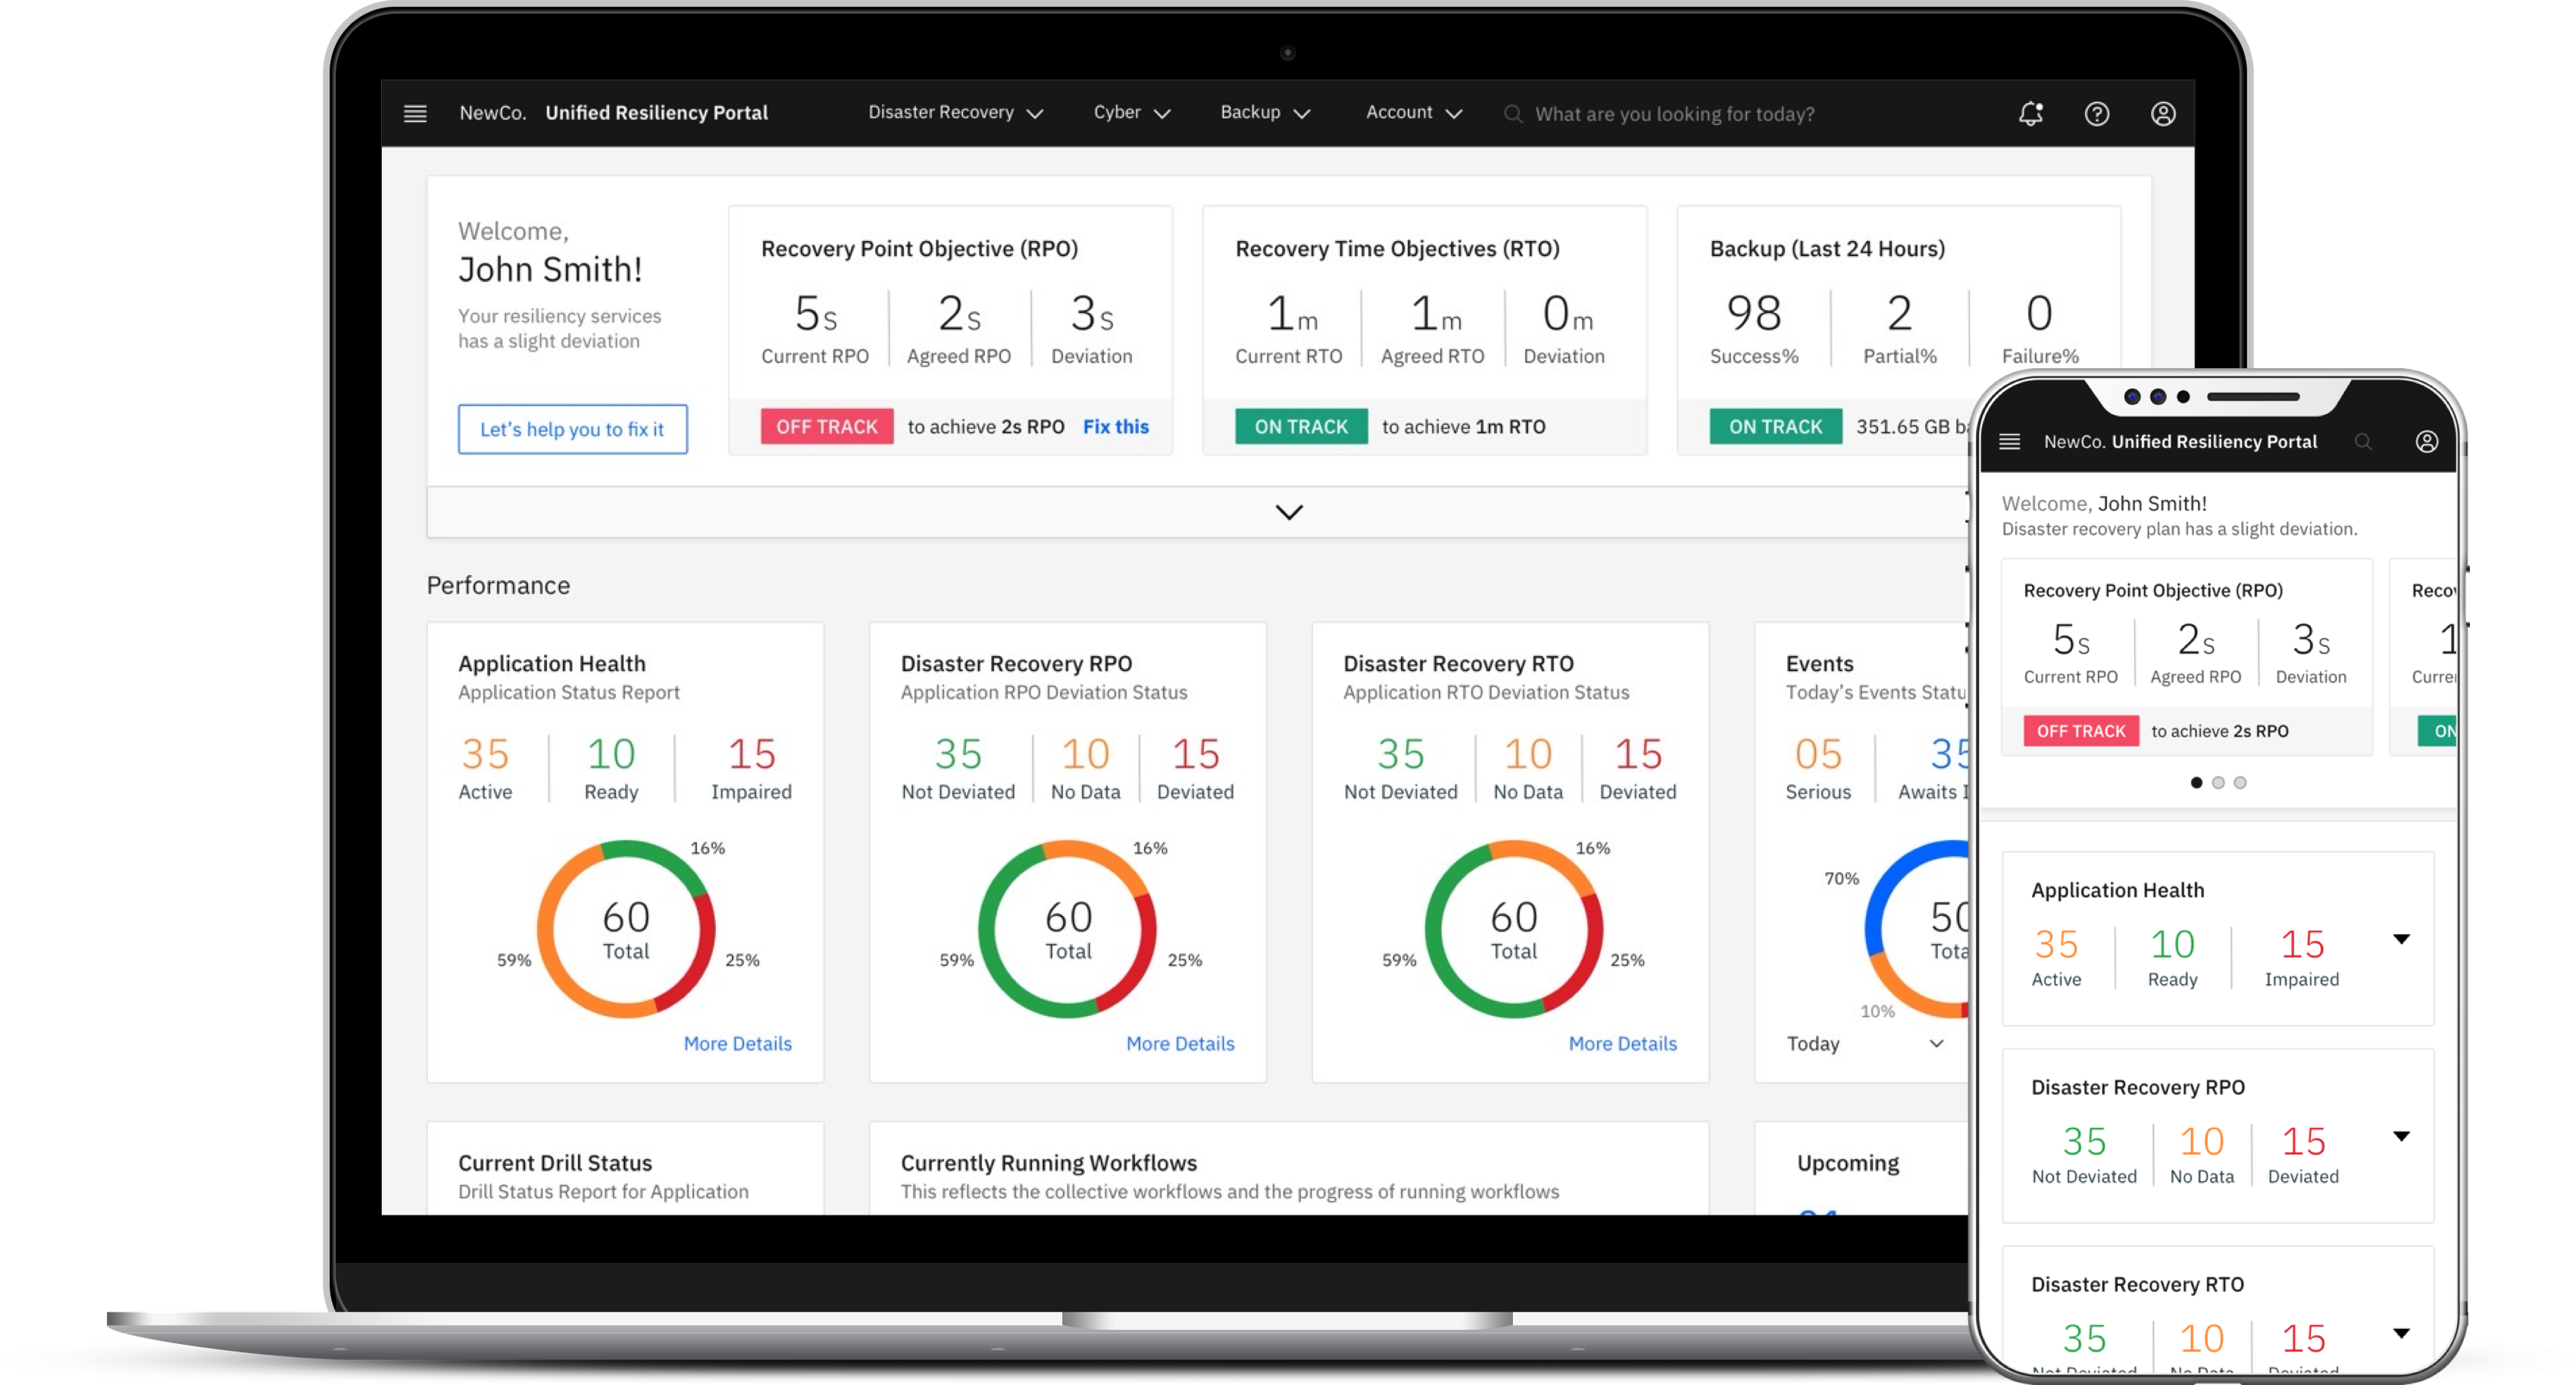
Insight-Driven Analytics for Real-Time Monitoring and Reportings
Designed a centralized dashboard with real-time risk assessment and predictive insights.
KPI : Important metrics that helps customer to make sure that they can accomplish their business objective. System indicates whether KPI is ON TRACK / OFF TRACK and helps the customer to fix the errors.
This helps us in achieving goal
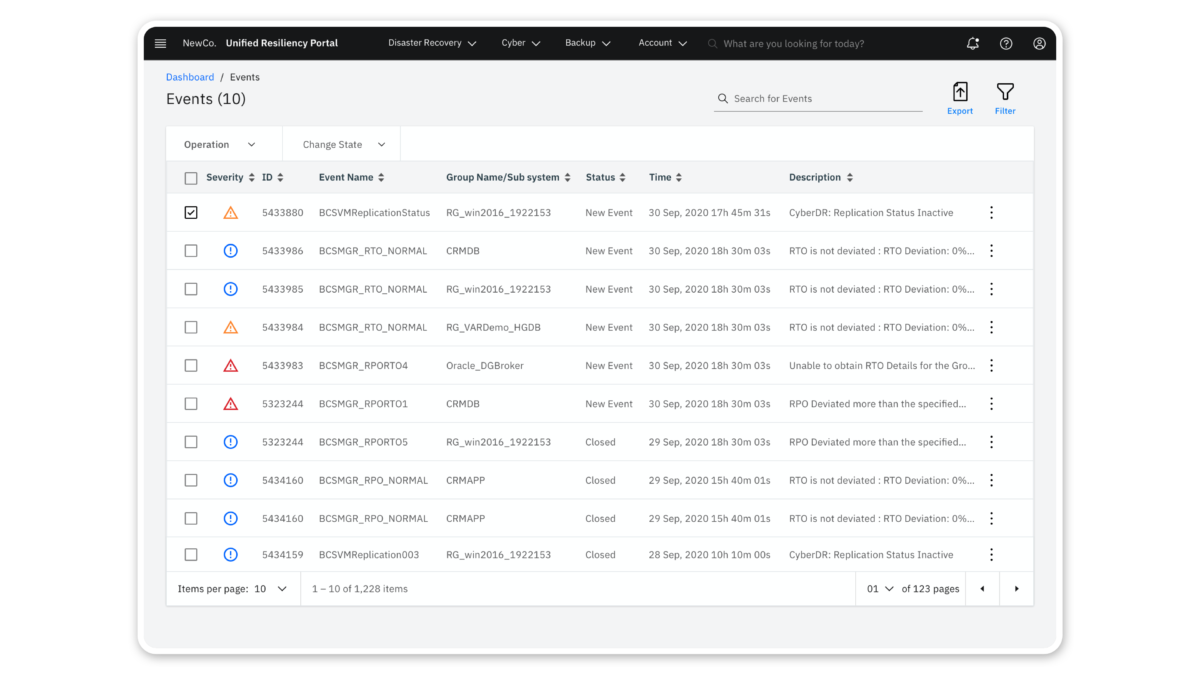
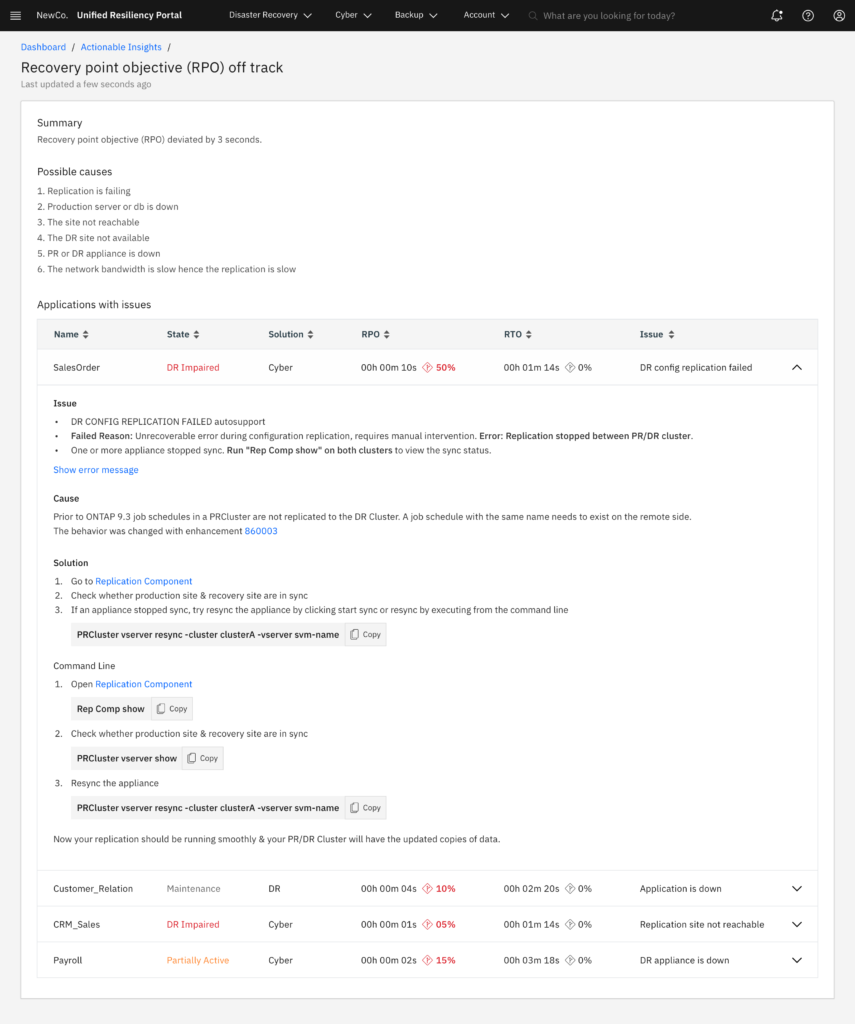
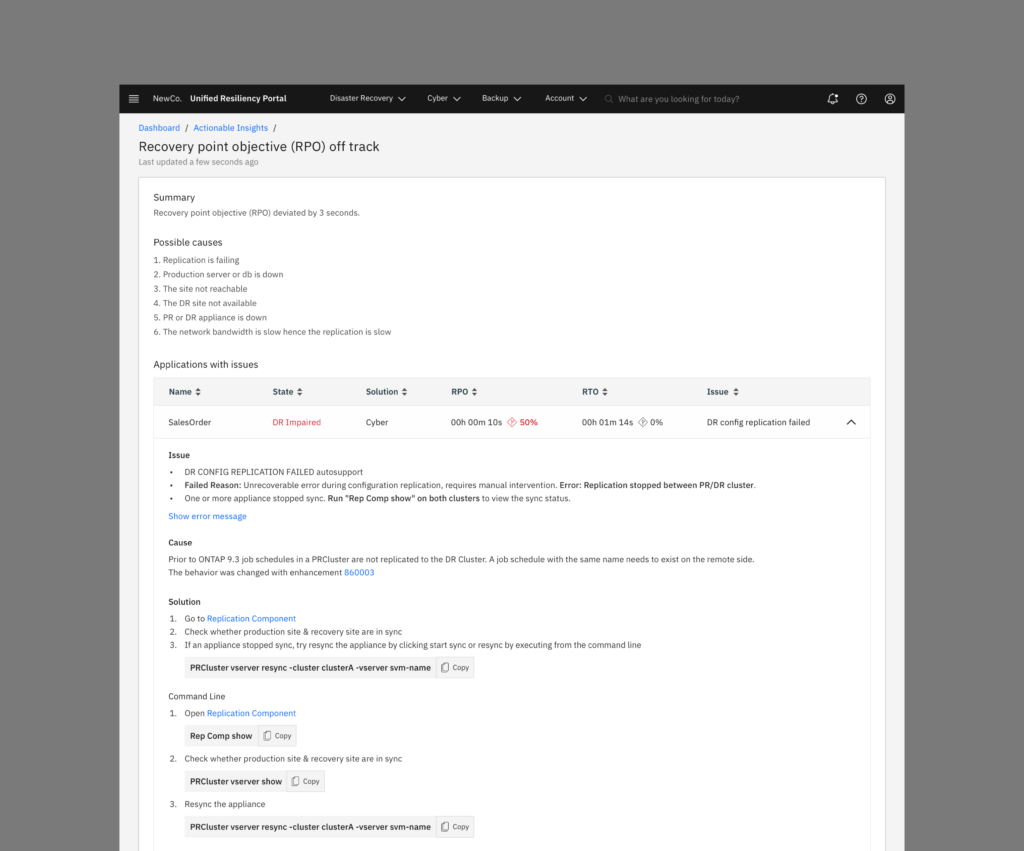
AI INSIGHTS
Smarter Insights to Improve ROI
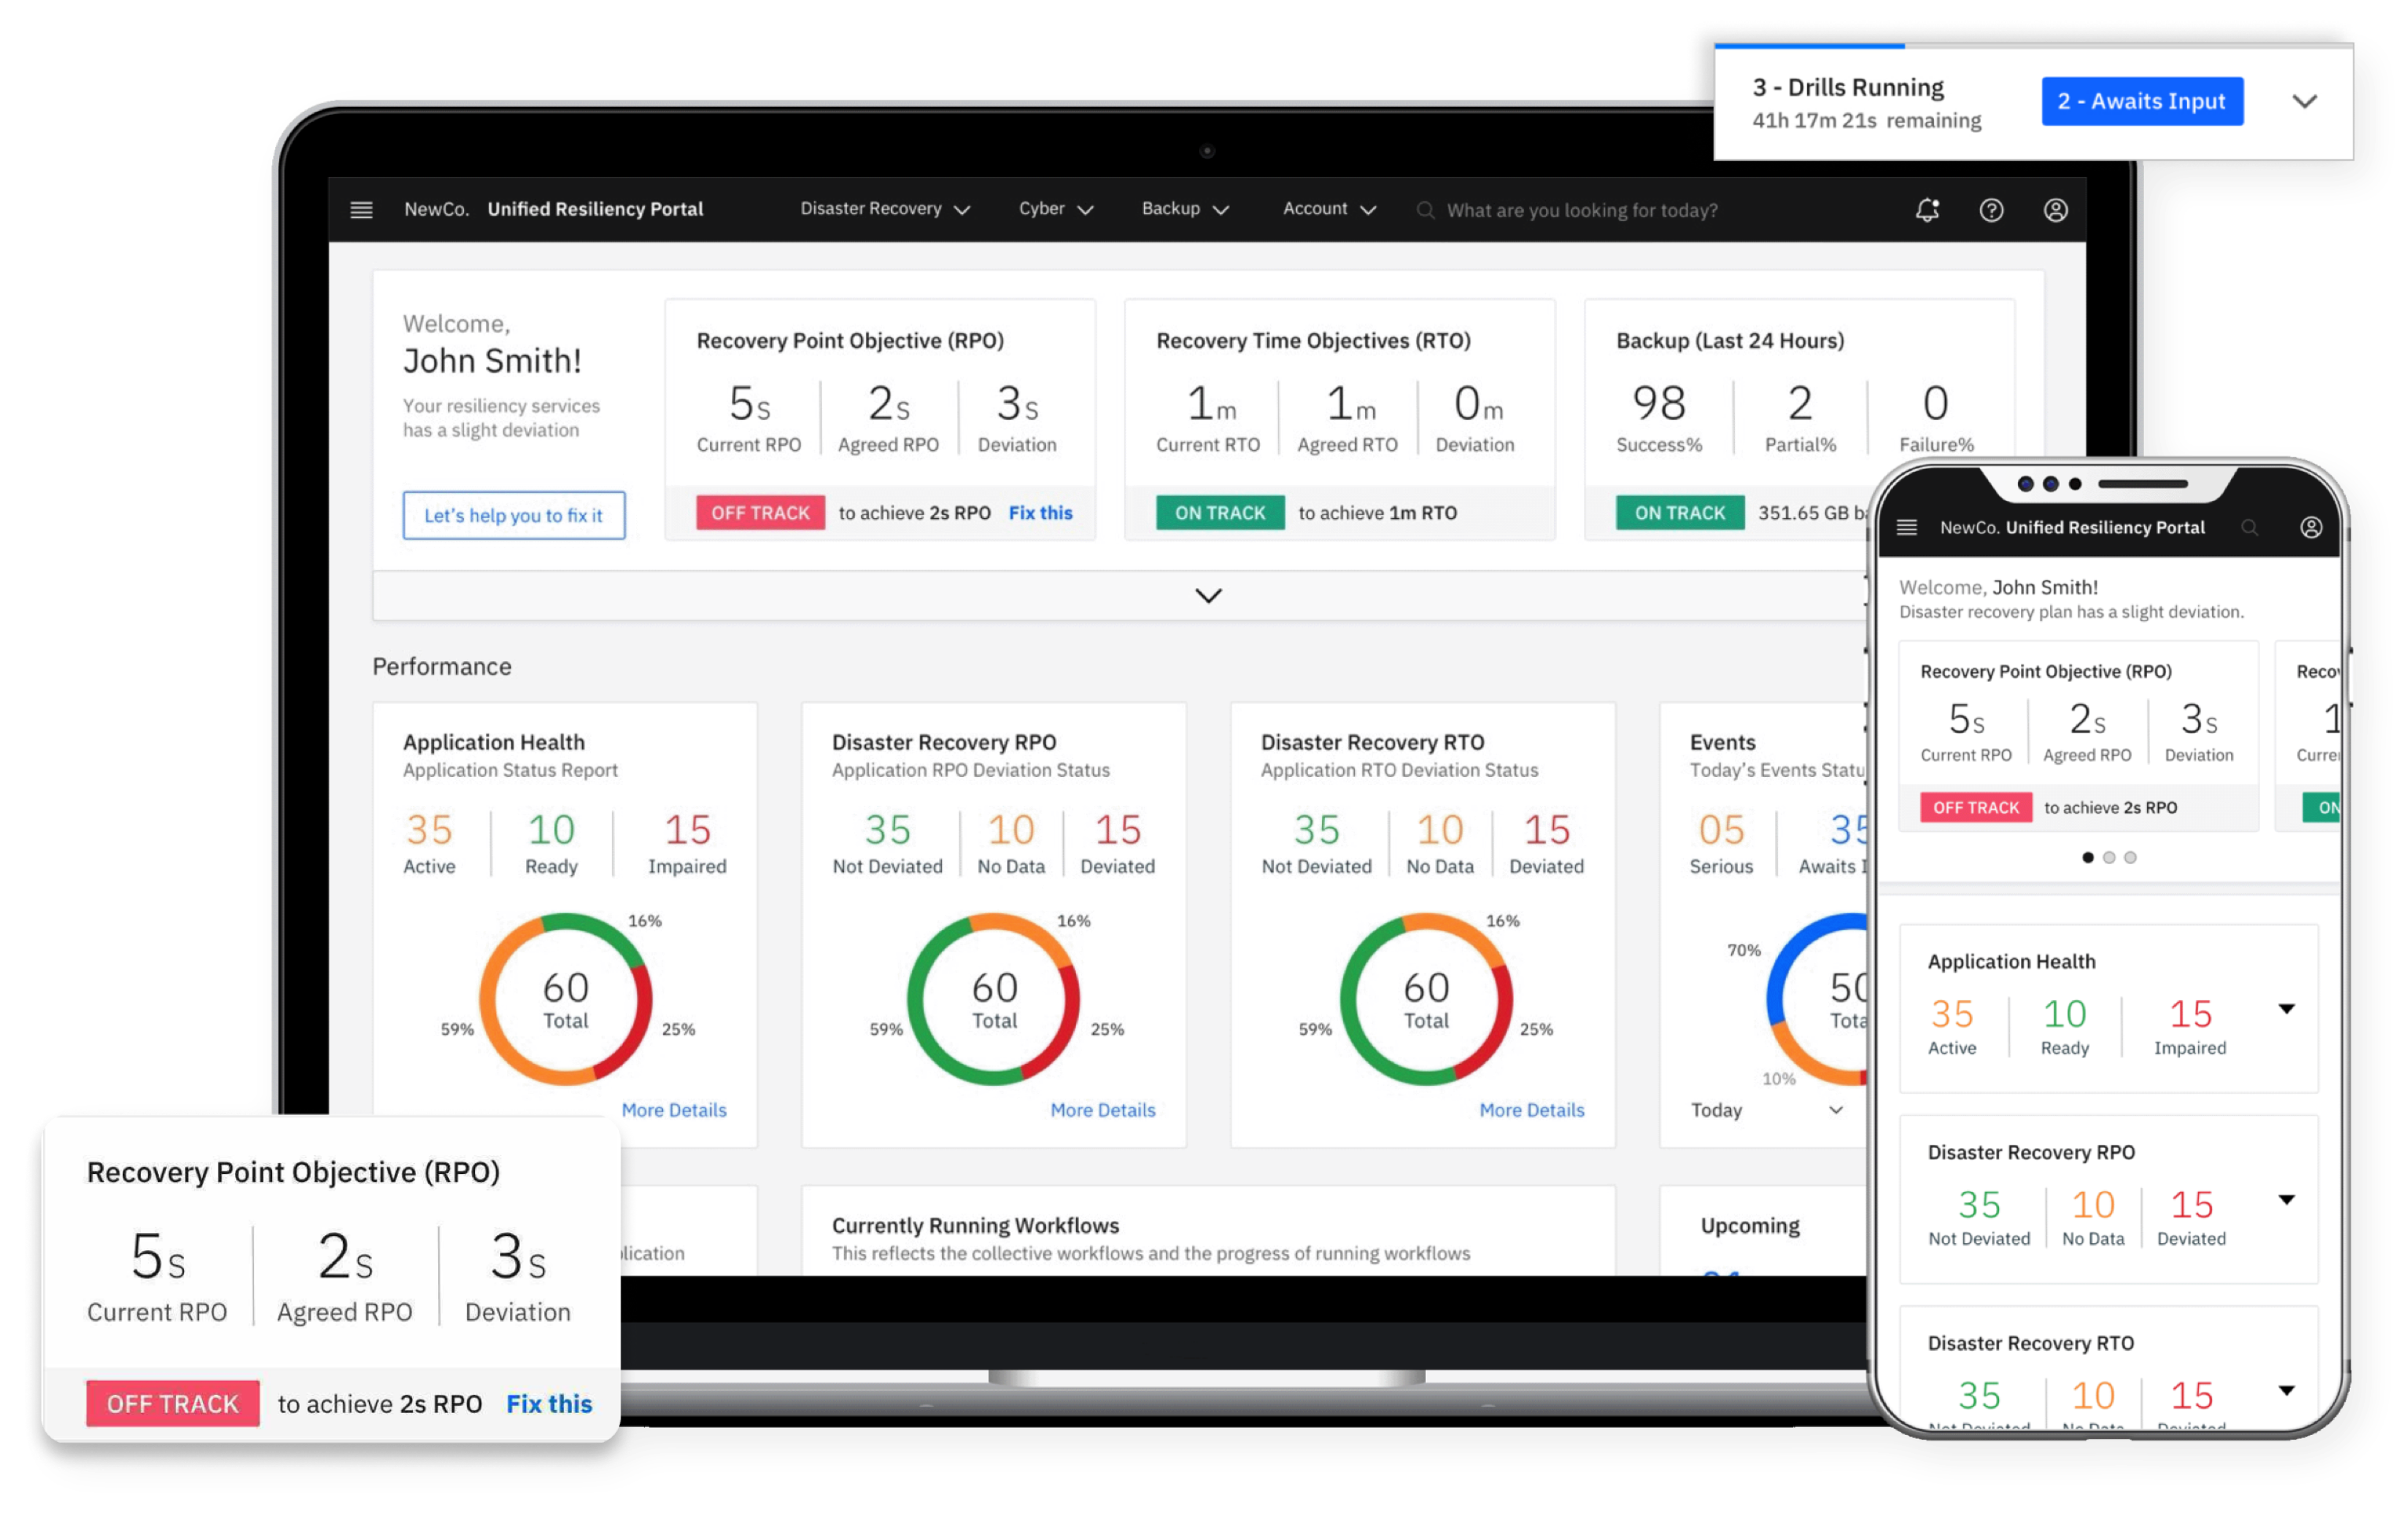
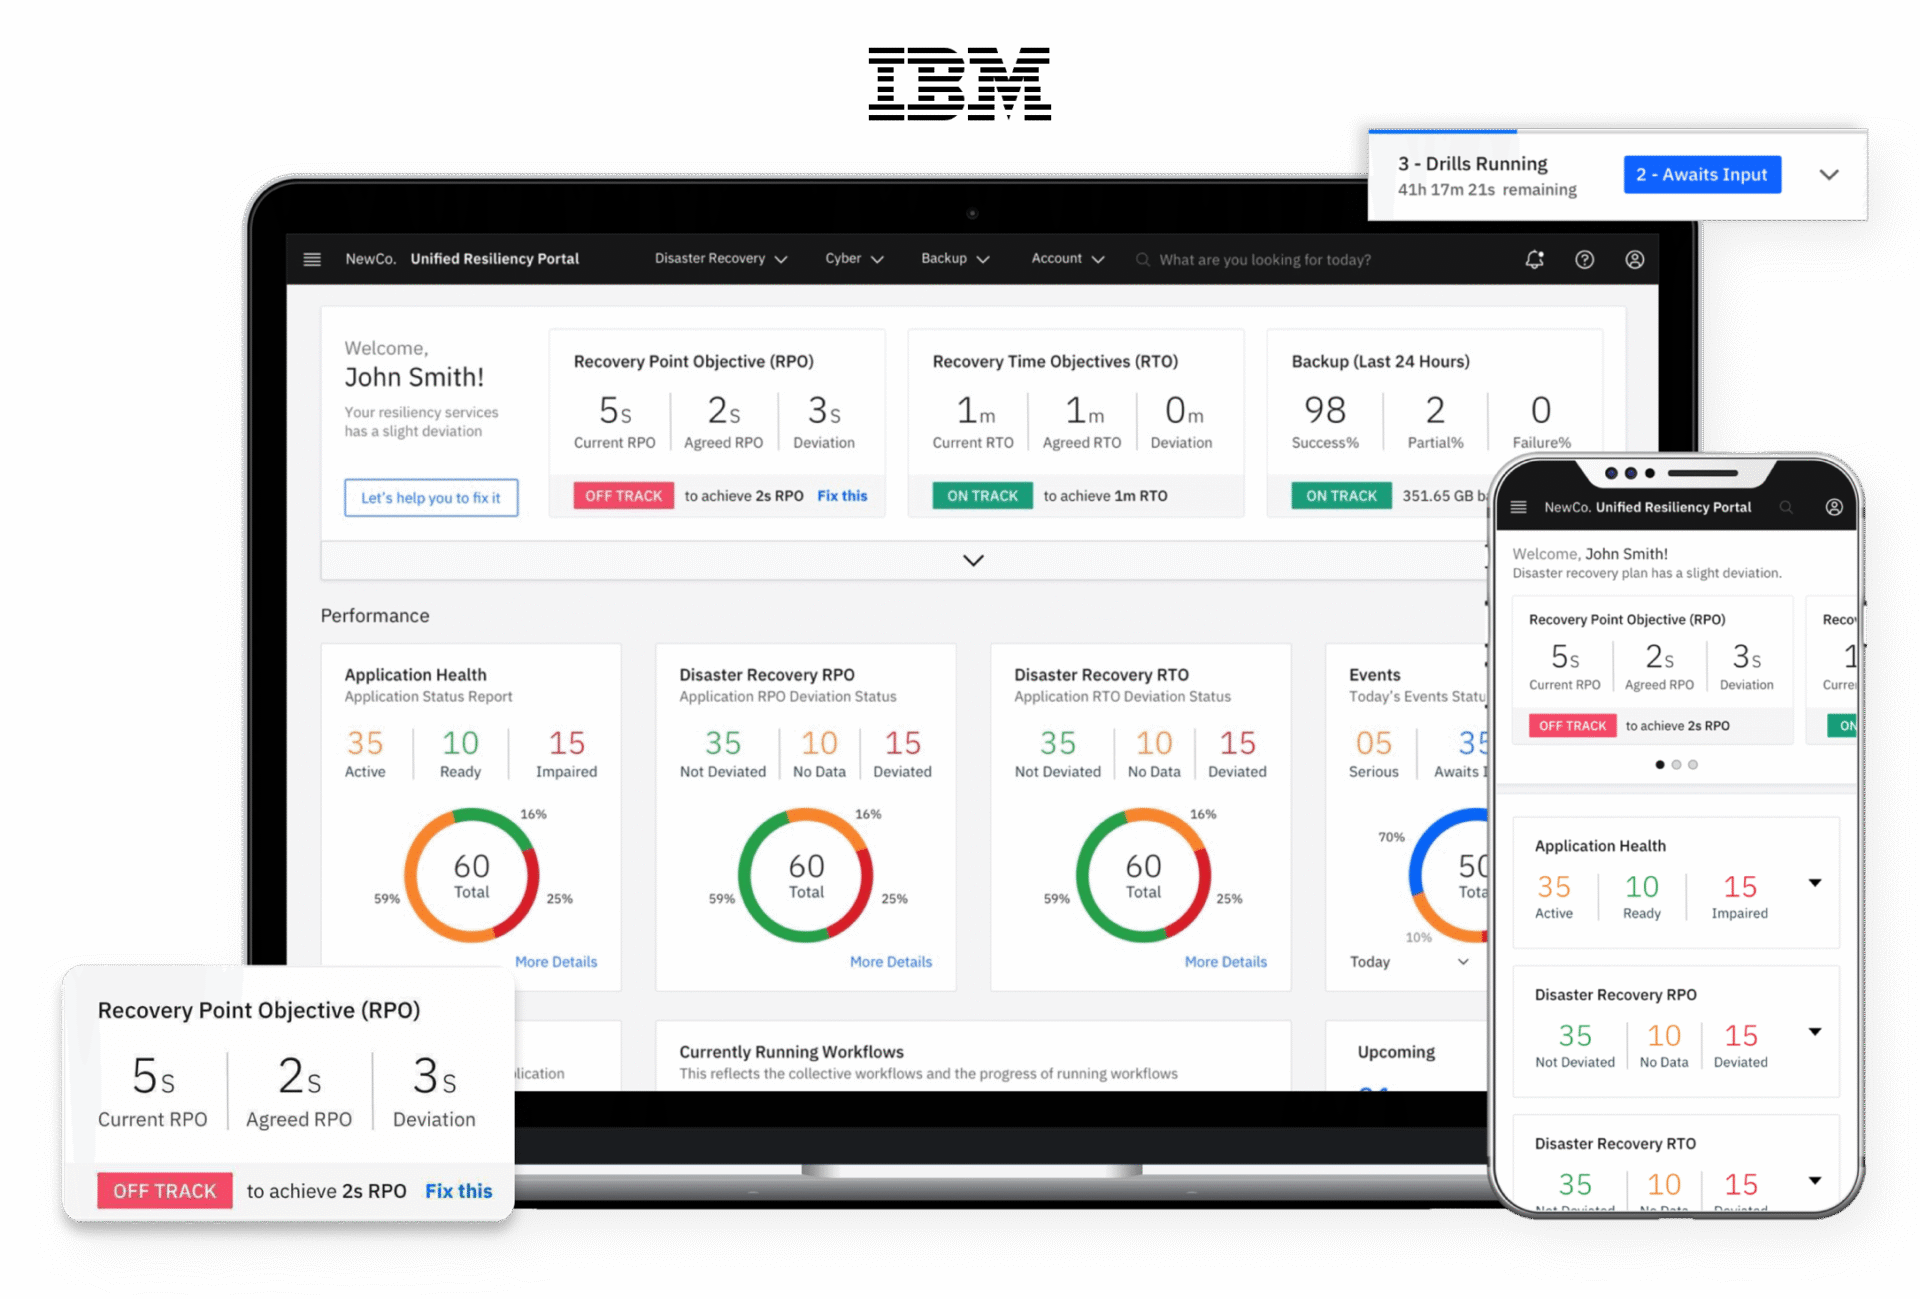
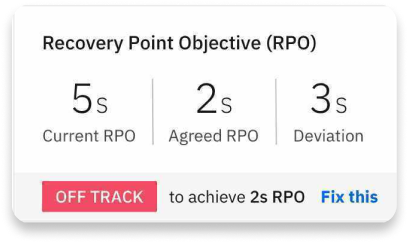
Using machine learning to discover new and predictive insights from the data such as Recovery Point Objective (RPO) and Recovery Time Objective (RTO), enabling us to reduce recovery time from hours to minutes.
Guide when there is a deviation in SLA : Whenever there is a deviation, we help the customer to fix the errors to achieve their strategic goals.
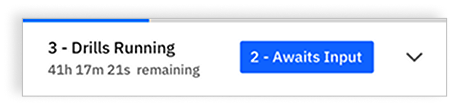
Currently running information : A small floating window at the bottom right corner indicates the currently running drills/backups.
This alone is already a very strong USP. This helps us in achieving goal
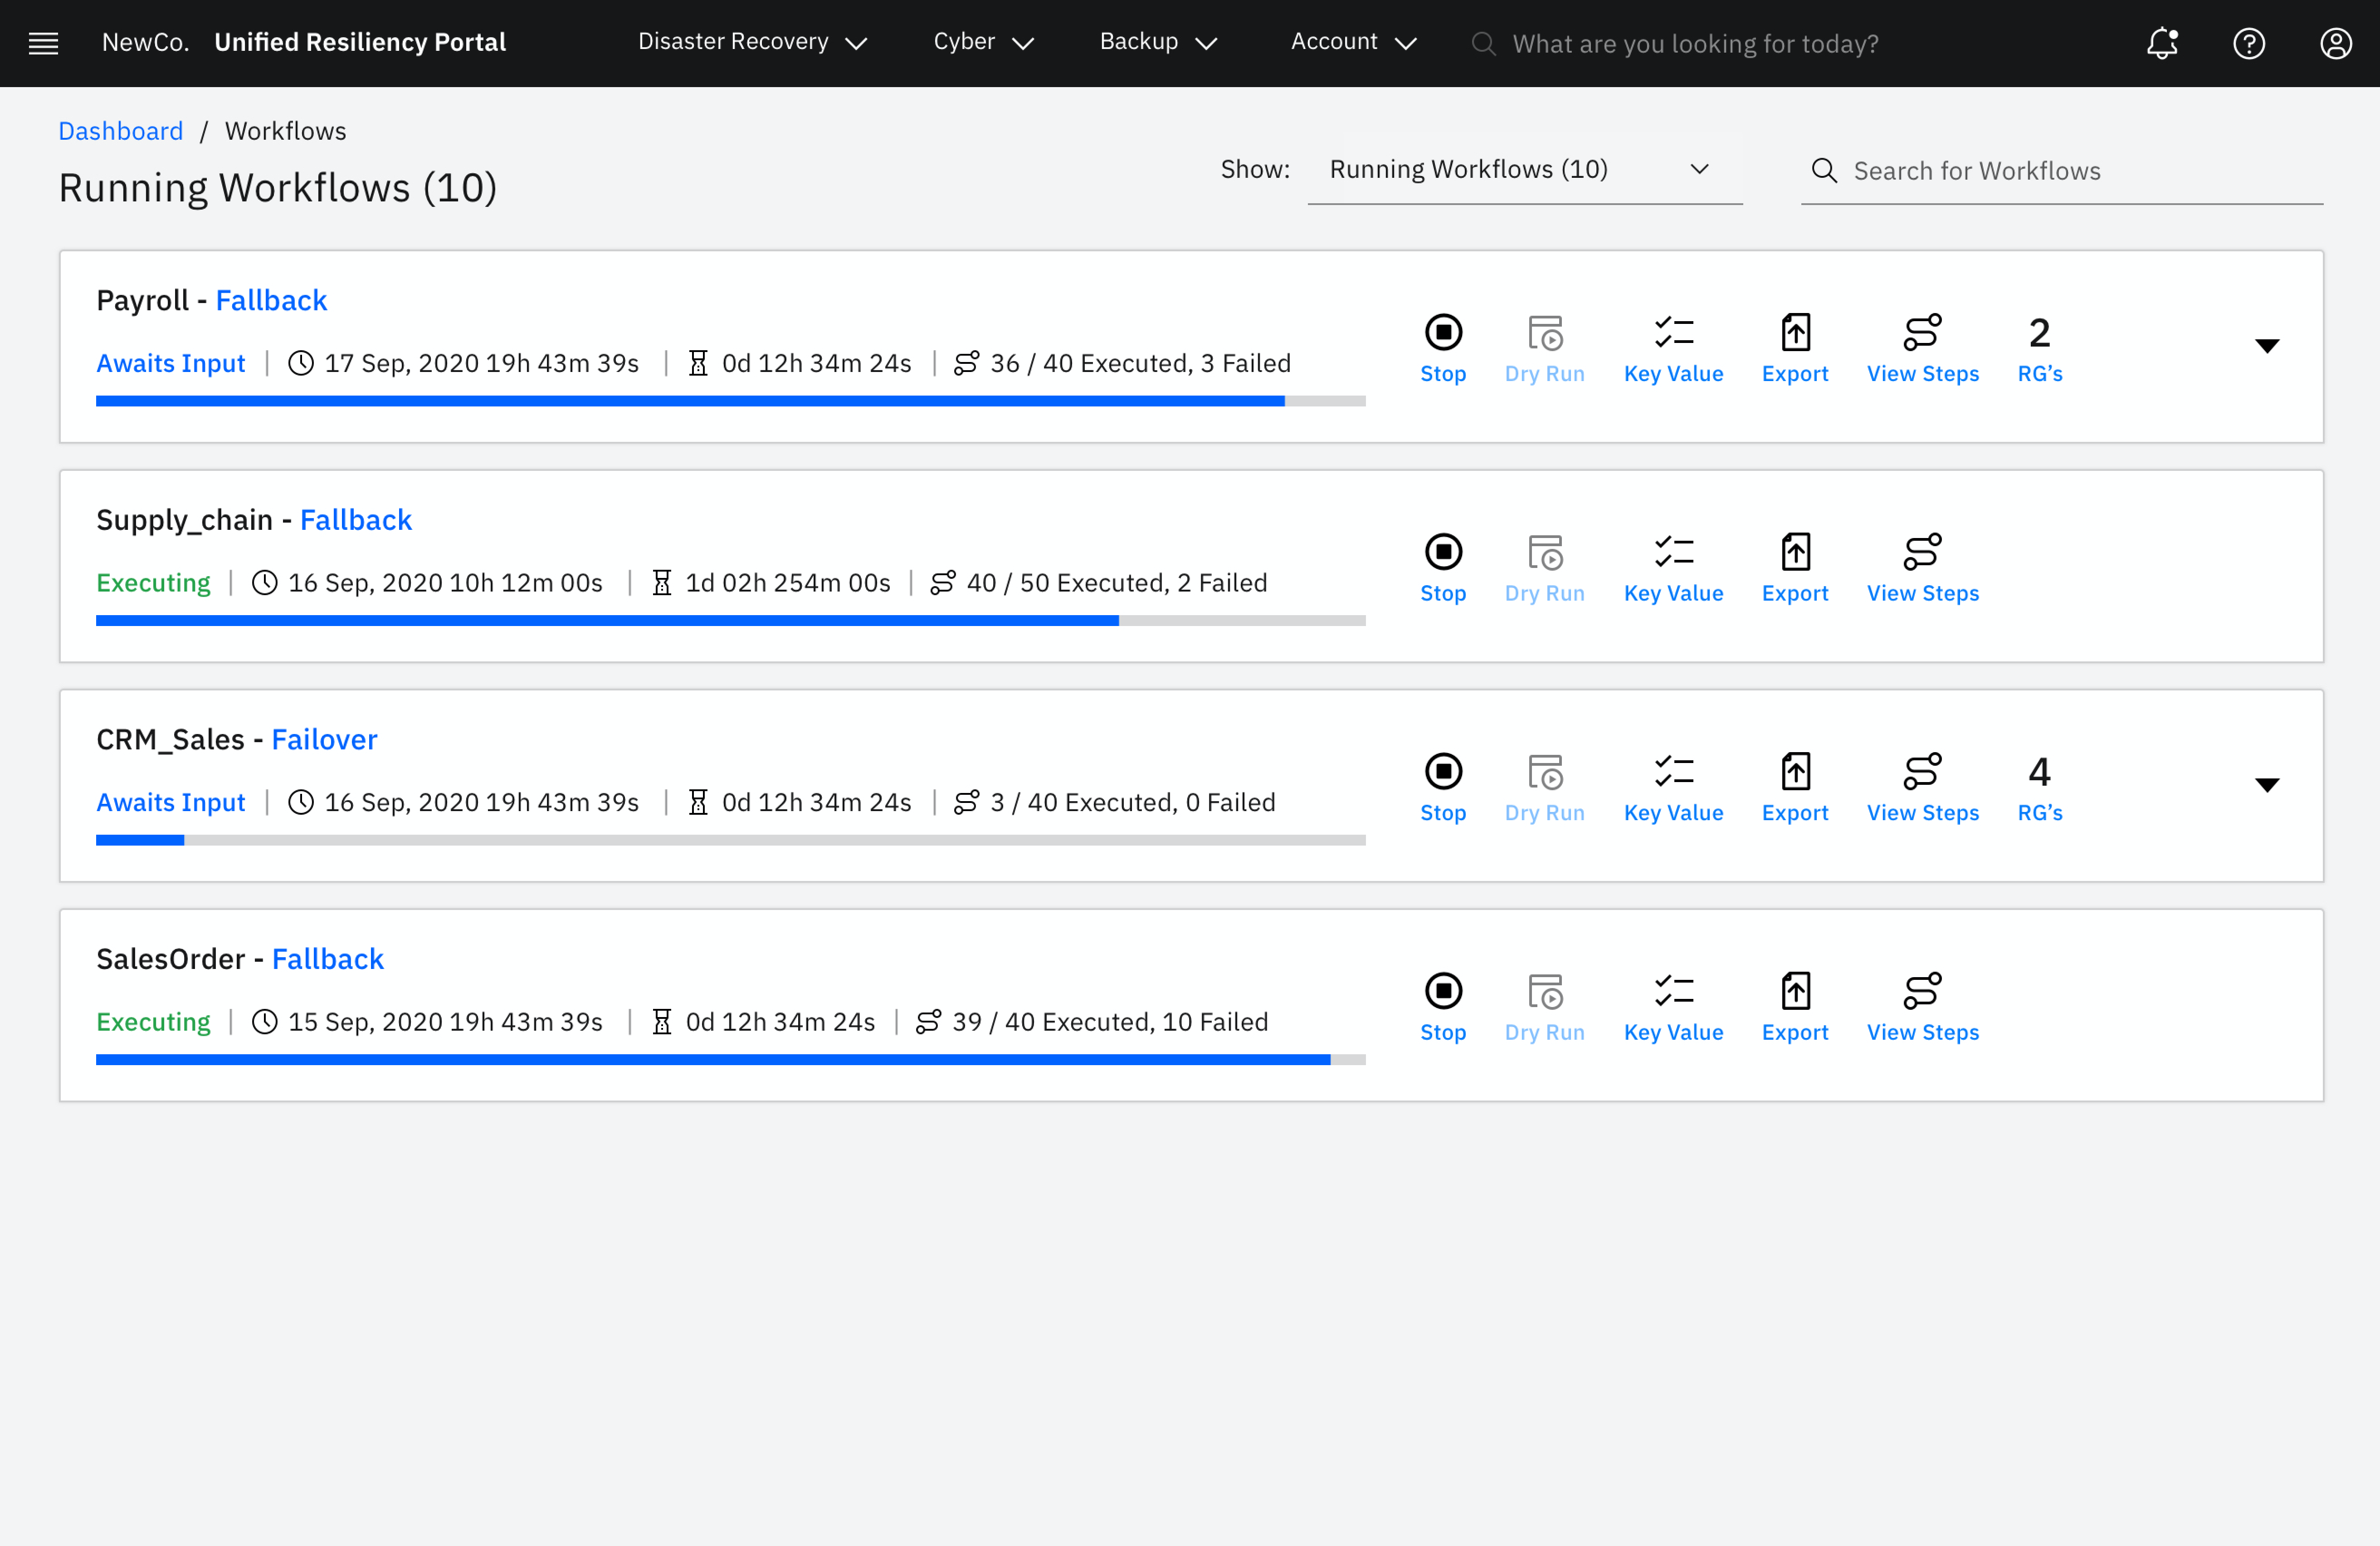
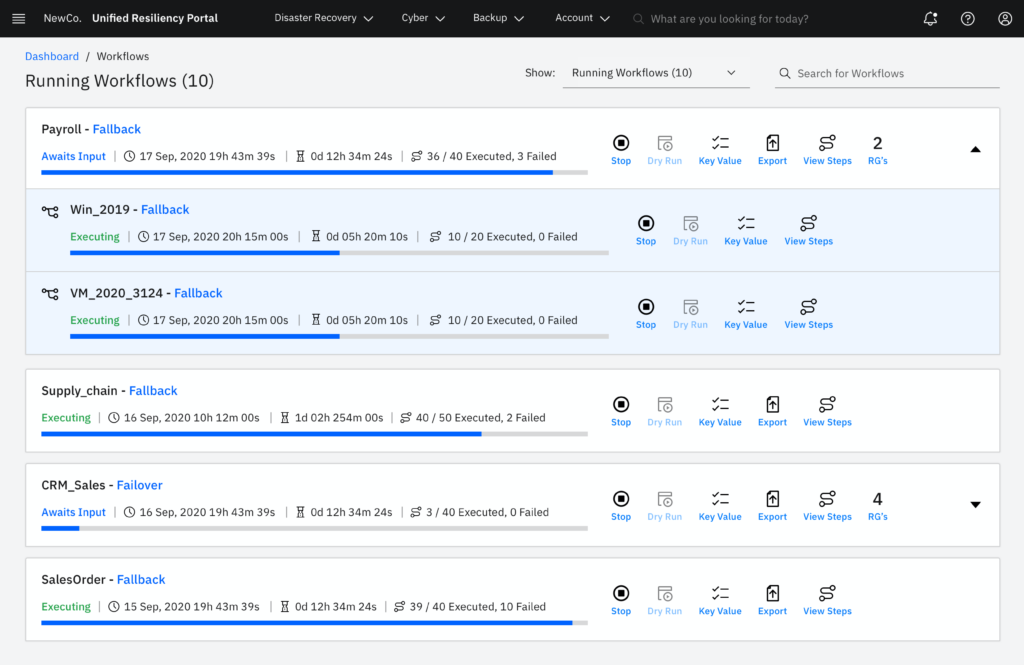
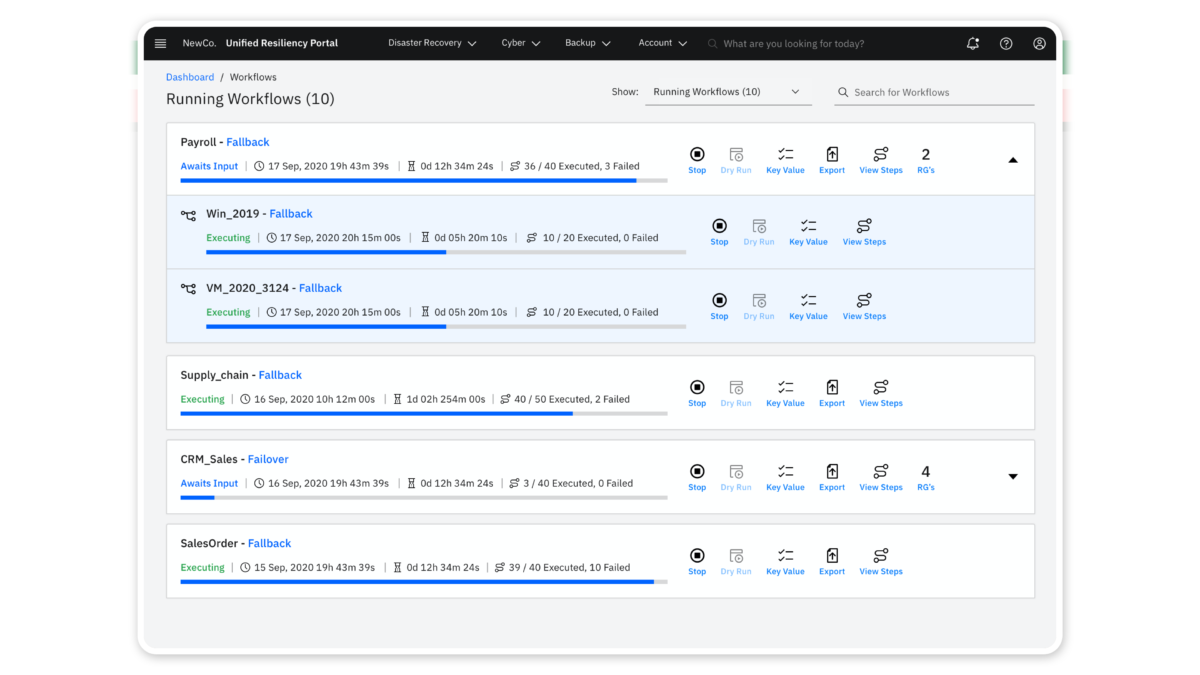
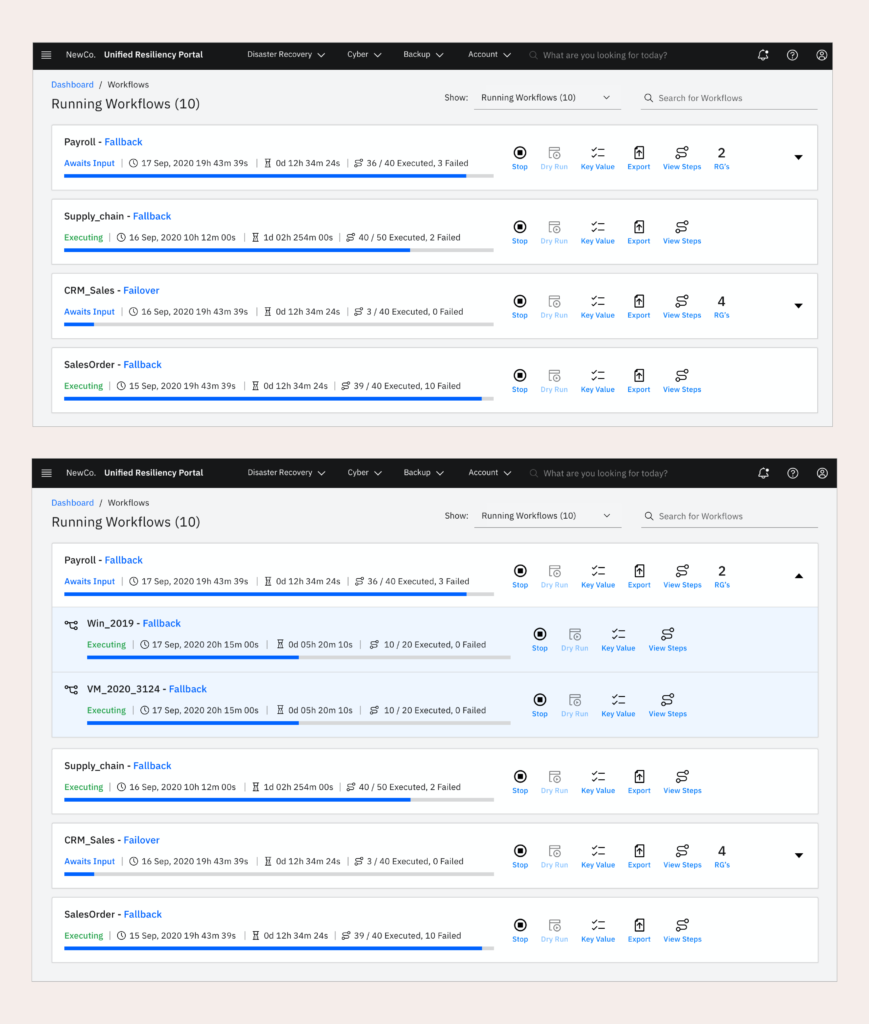
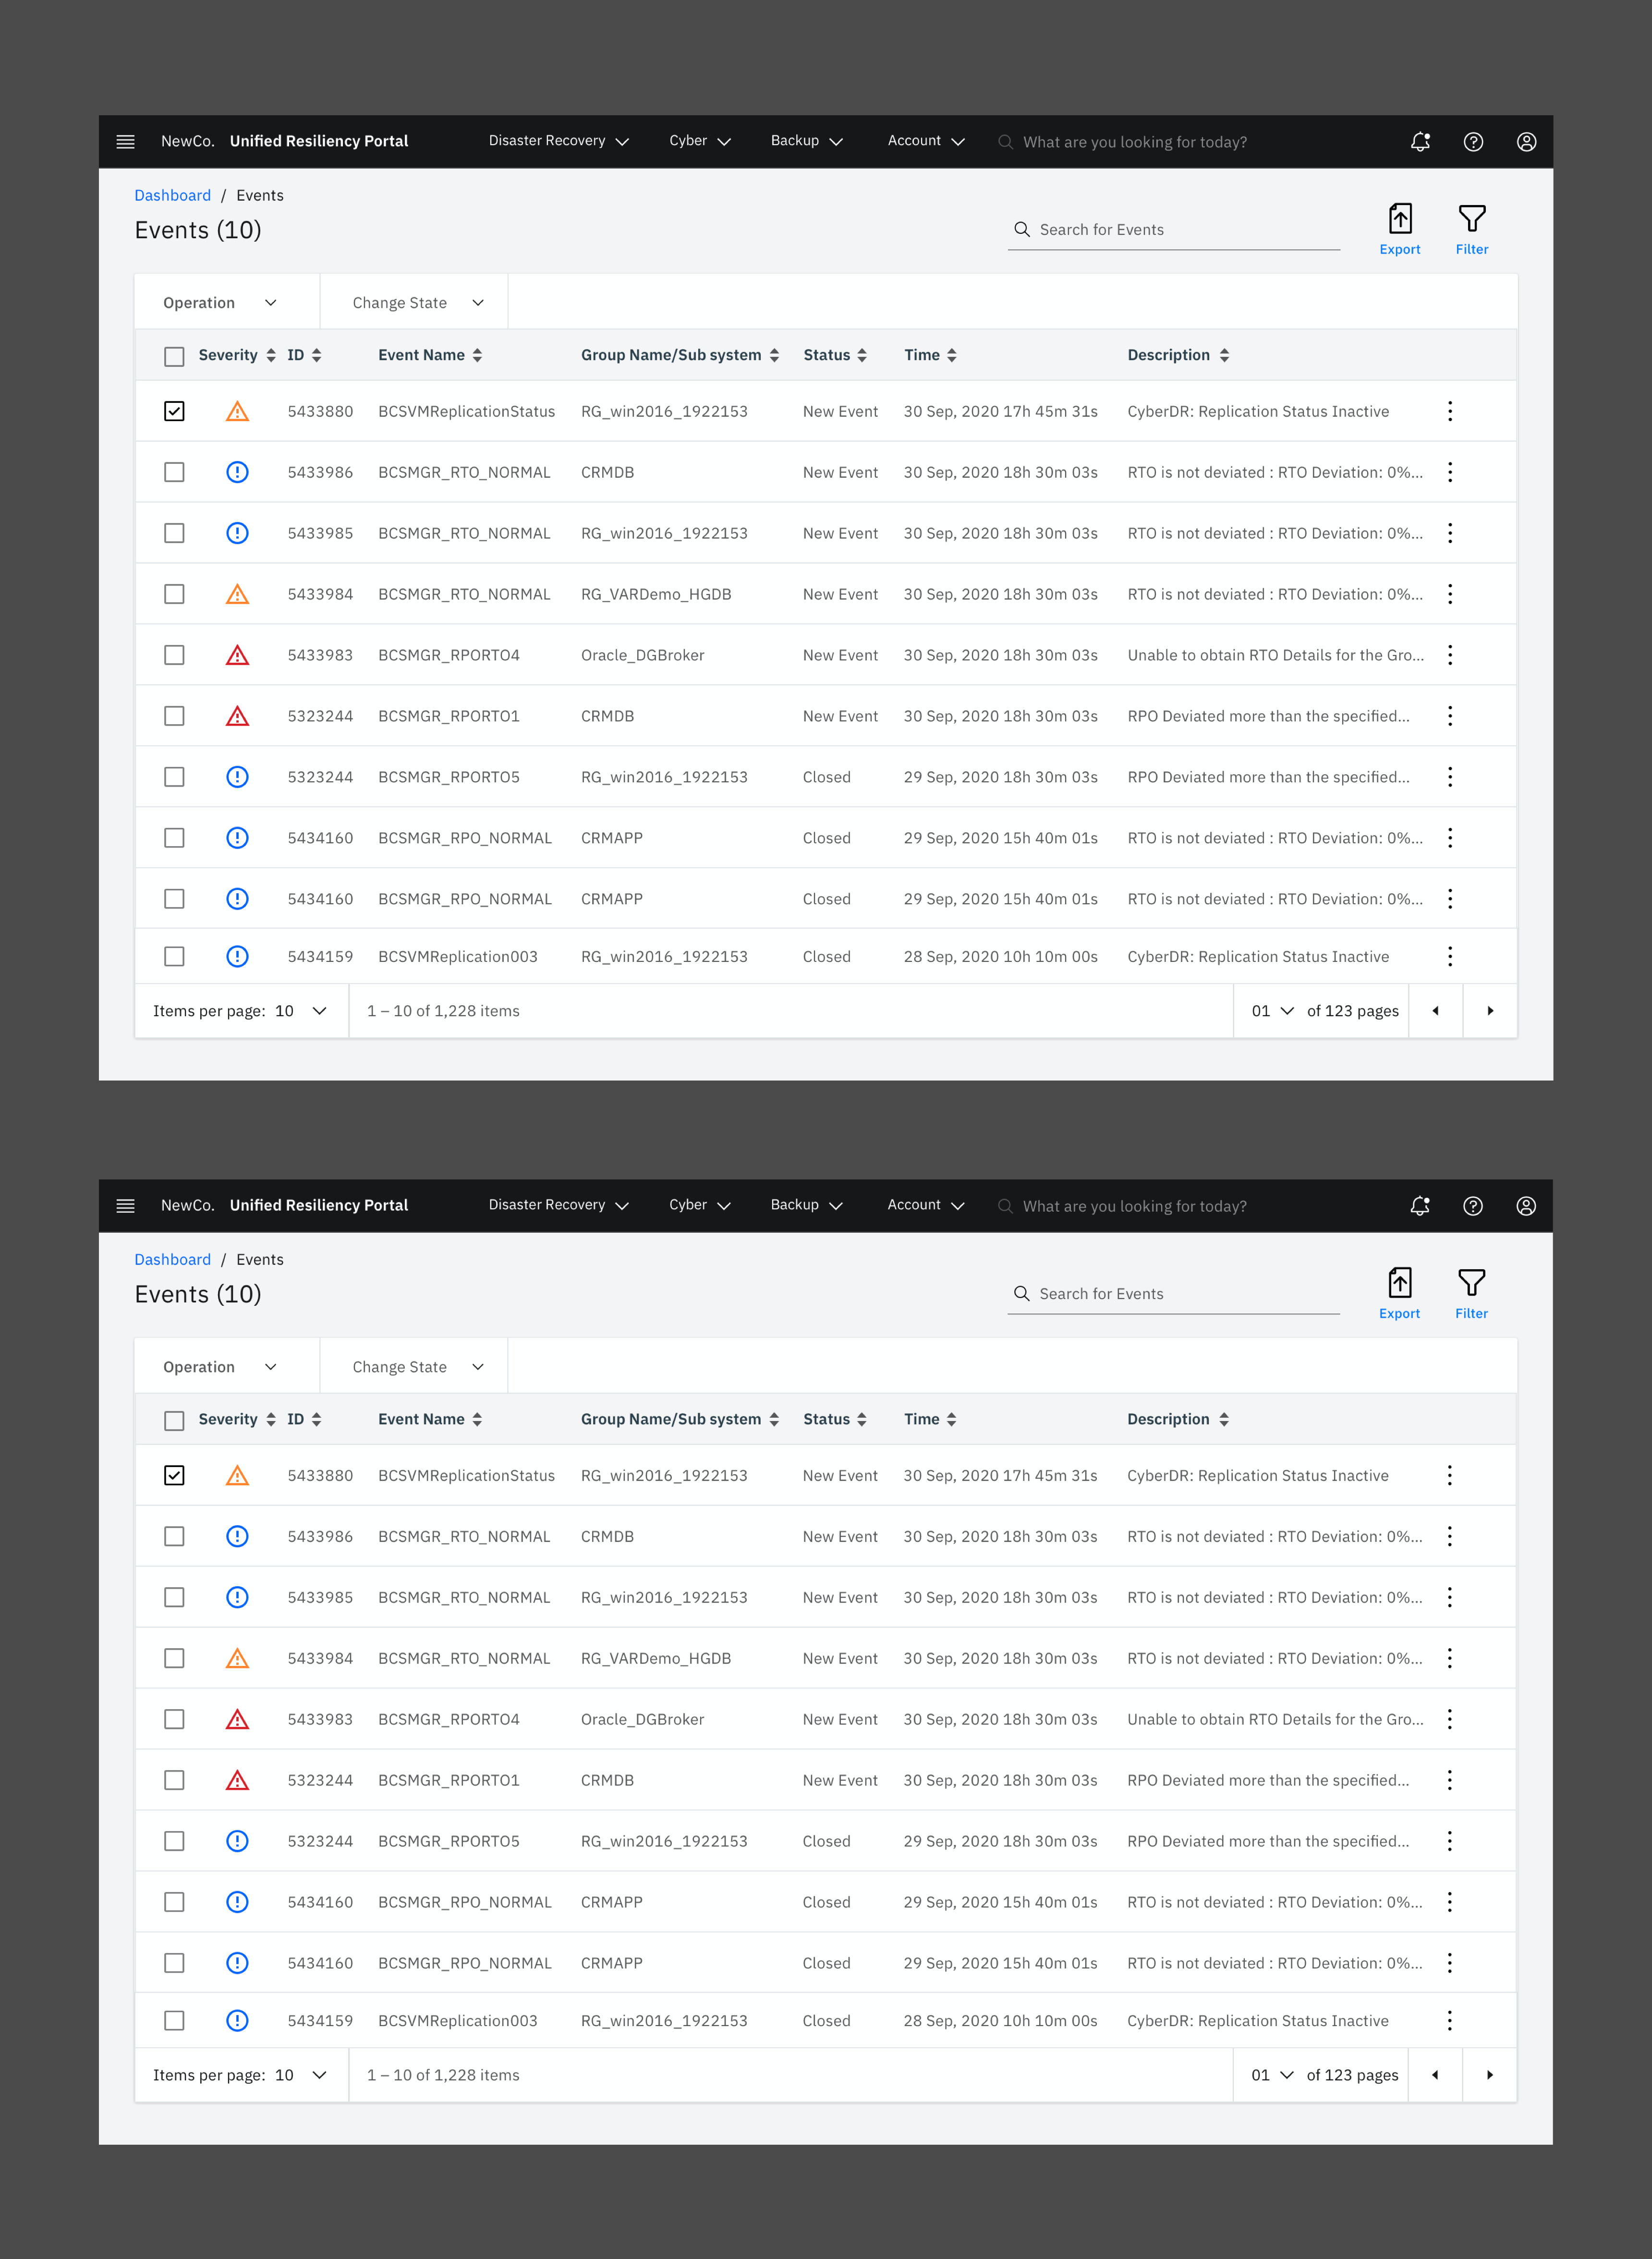
WORKFLOW SCREENS
Automated Workflows and Recovery
Automated drills initiated from application pages or scheduled workflows provide brief information on running workflows, including status, start time, estimated time, and steps executed. A small floating window at the bottom right corner of all pages displays the status of running drills or backups in progress.
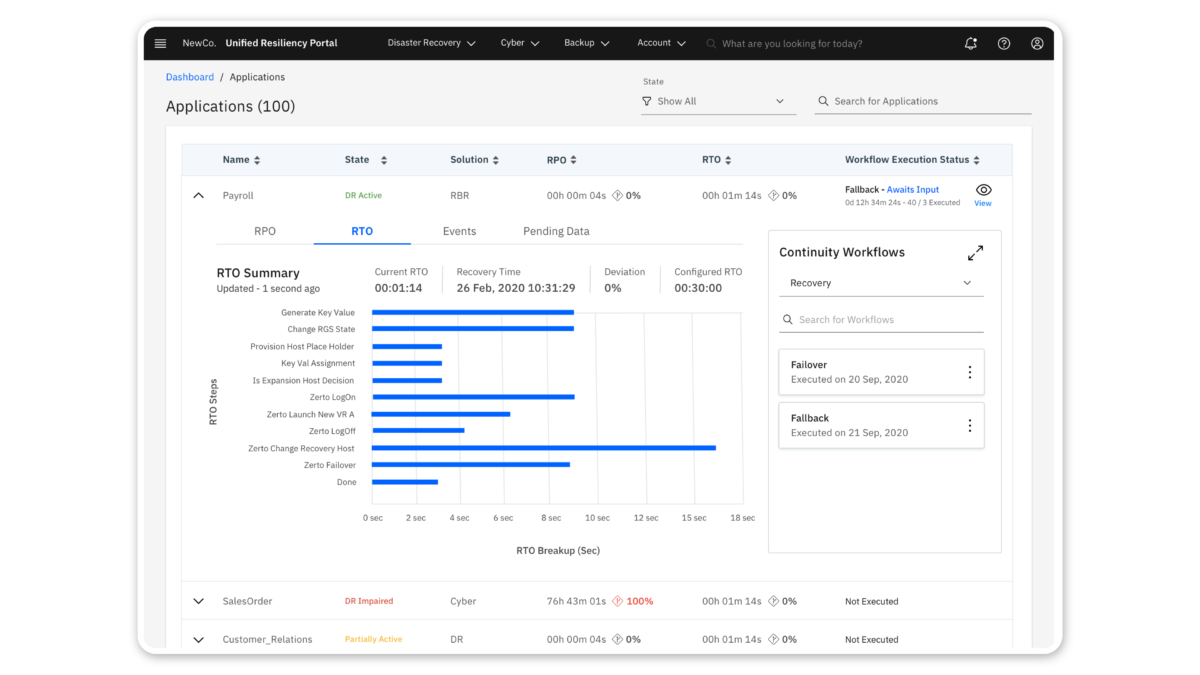
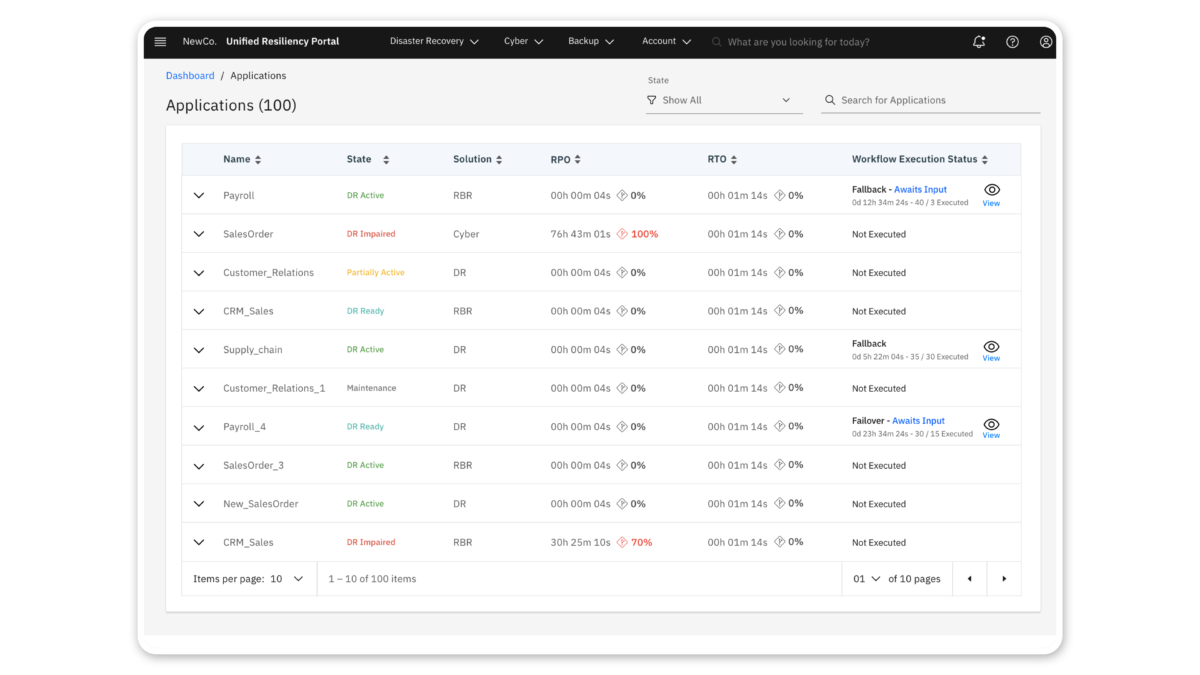
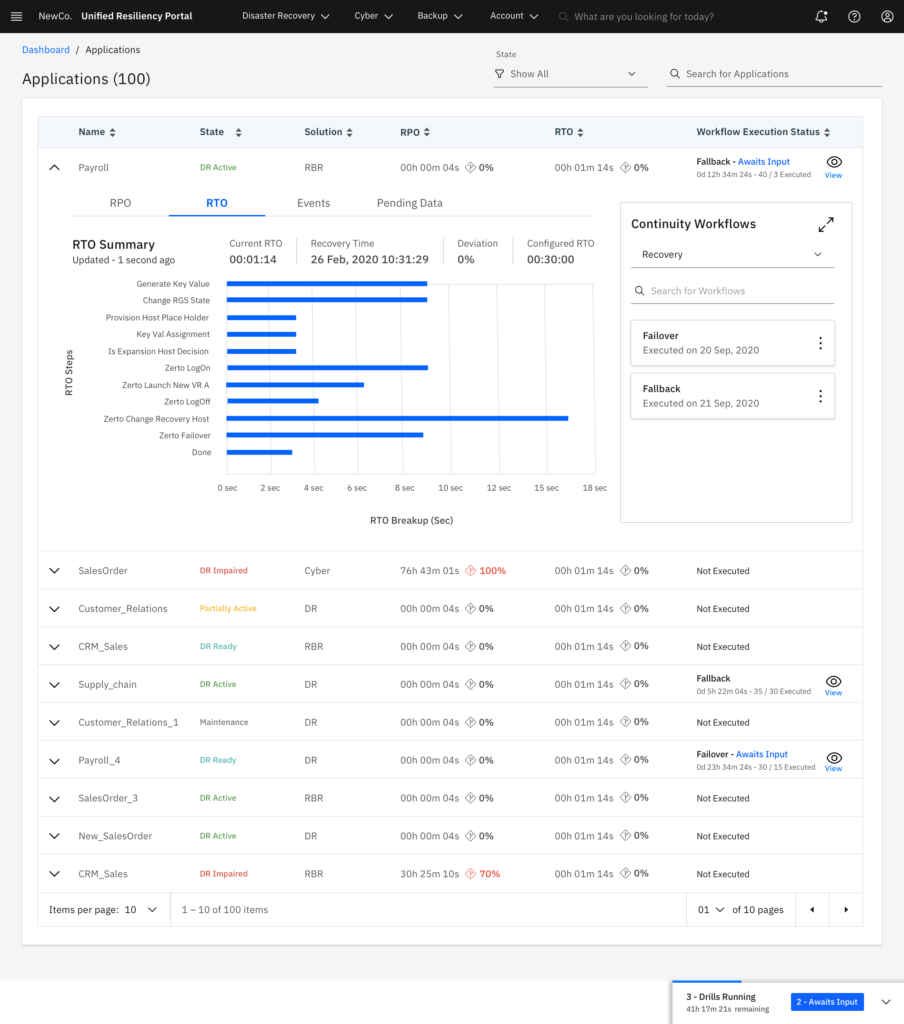
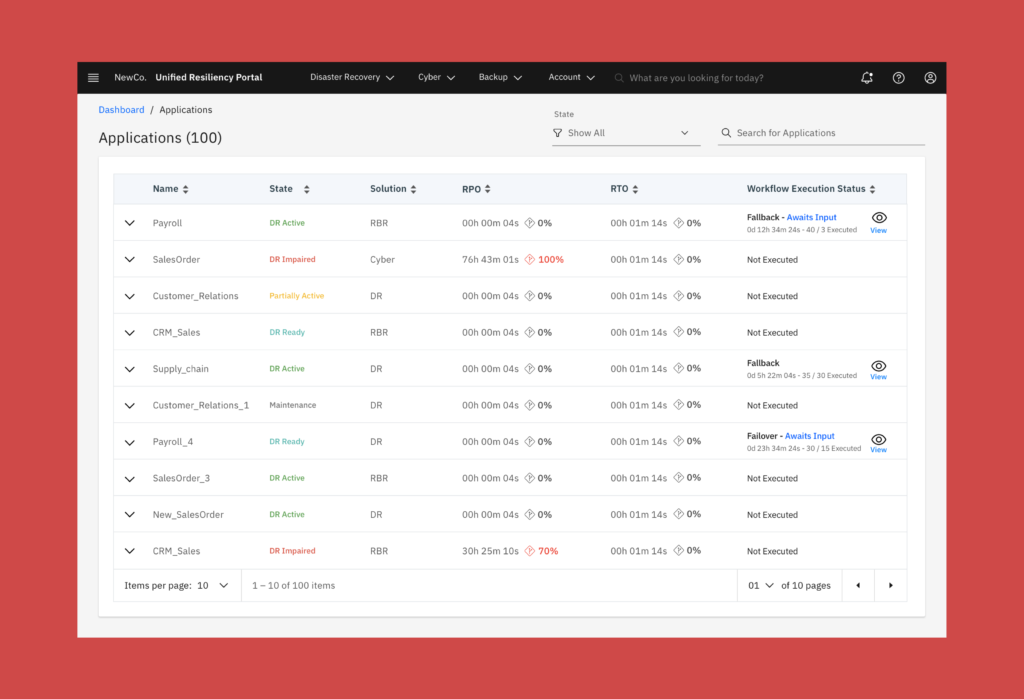
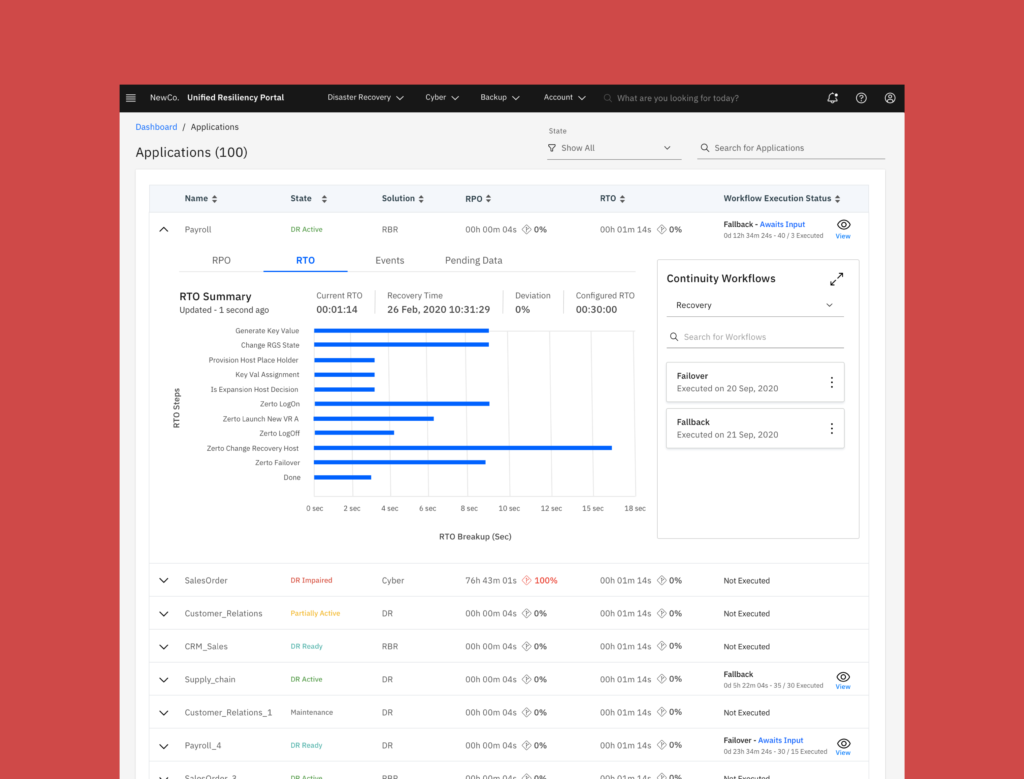
APPLICATIONS
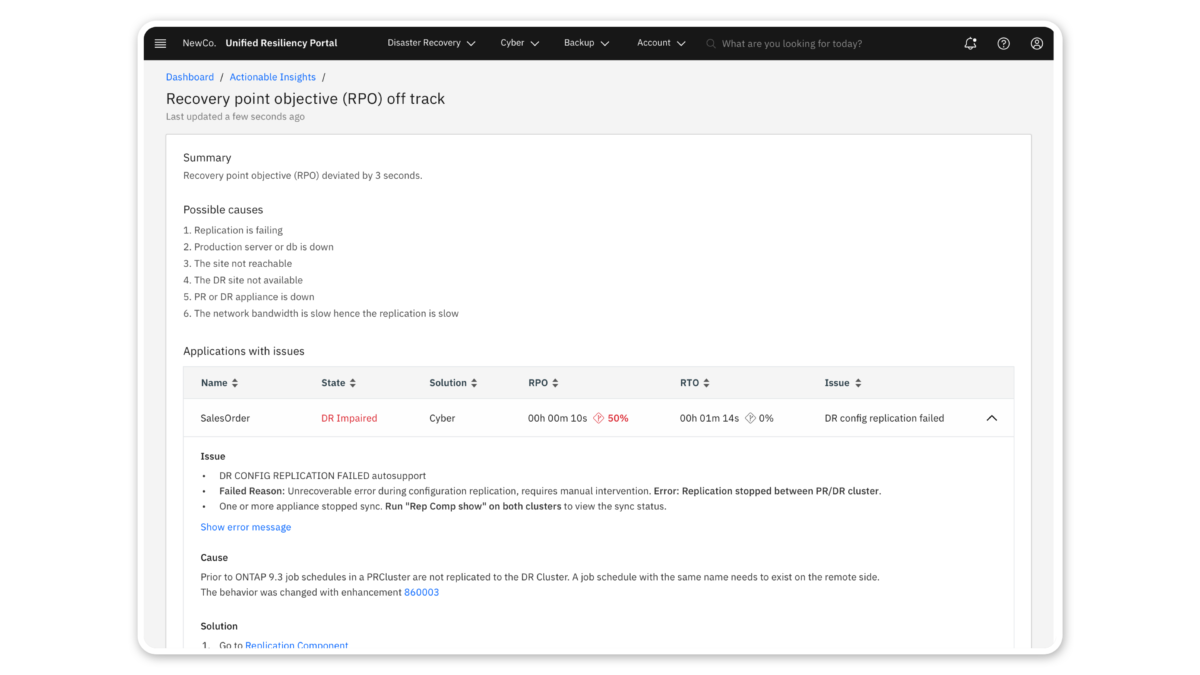
Protect Applications, Not Just Data
Safeguard complex Enterprise applications across multiple VMs, hosts, datastores, and storage systems. Ensure seamless coordination between data and application states. Access detailed application information, such as RTO, RPO, Events, and Replication status, within an accordion-style view when selecting an application from the list. Customers can conveniently trigger workflows directly from this view.
TESTING
Testing & Iteration
Testing was a critical phase to ensure the platform met user needs and business goals.
The process included:
Usability Testing:
- Conducted remote and in-person usability tests with target users, including IT administrators, security analysts, and C-level executives.
- Tested key workflows such as incident tracking, risk assessment, and dashboard customization.
- Gathered qualitative feedback on ease of use, clarity of information, and overall satisfaction.
A/B Testing:
- Tested multiple variations of the dashboard layout, alert systems, and navigation menus.
- Measured user engagement, task completion rates, and time spent on critical tasks.
- Identified the most effective design patterns for user efficiency.
Key Learnings:
- Users preferred a timeline-based incident tracking system for better visibility.
- Real-time notifications were crucial for proactive decision-making.
- Customizable dashboards improved user efficiency by 35%, as users could prioritize relevant data.
- Tooltips and onboarding flows significantly reduced friction for new users.
Iterative Refinements:
- Simplified data visualizations based on feedback to reduce cognitive load.
- Enhanced the AI-driven alert system to provide more actionable insights.
- Improved accessibility by refining color contrast and font sizes for better readability.
RESULTS
Implementation & Results
Final Product Features:
- AI-Powered Incident Detection: Real-time alerts and predictive insights.
- Automated Resilience Workflows: Reduced manual tracking efforts.
- Customizable Dashboards: Role-based views for different user needs.
- Seamless Integrations: Connected with enterprise tools like ServiceNow and Splunk.
Business & User Impact:
- 60% increase in active users after launch.
- 40% faster incident resolution time.
- 20% reduction in operational costs due to automation.
- CSAT improved to 4.6/5, based on customer feedback.

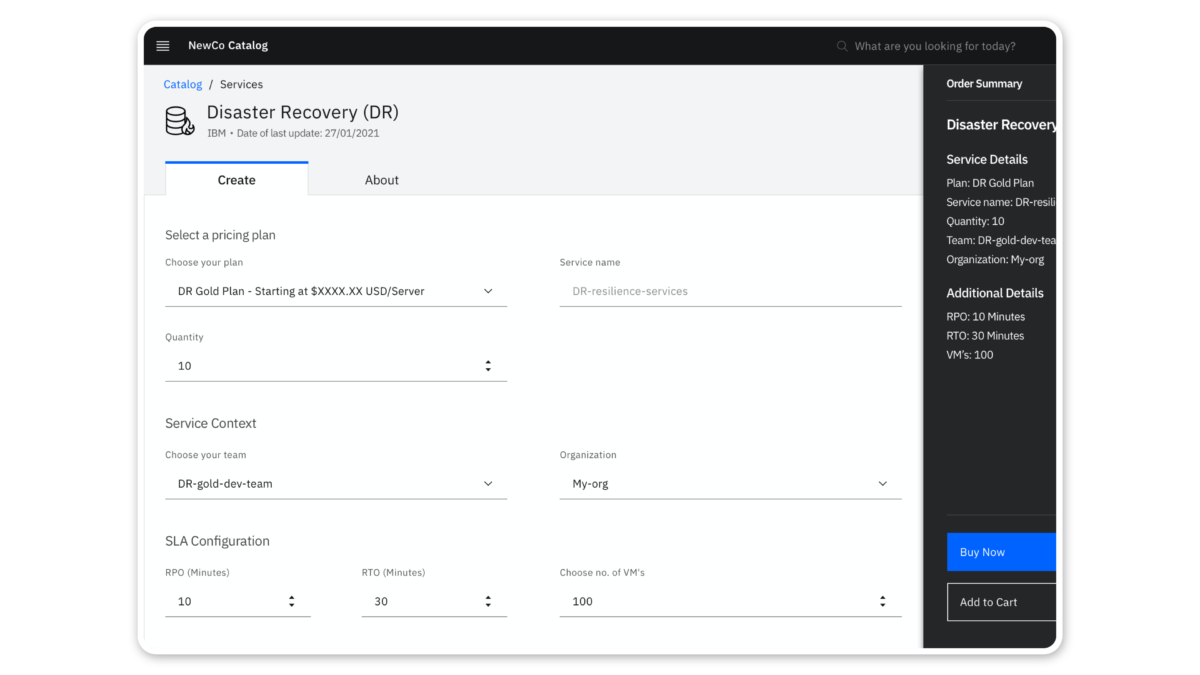
PROTOTYPE
Final Designs
Designed and implemented Disaster Recovery Automation solution that seamlessly adapts to business growth, meets stringent regulatory requirements, & minimises manual intervention to reduce the potential for human error..
FEEDBACK & ENHANCEMENTS
Customer Feedback & Future Enhancements
Customer Feedback Highlights:
- “The platform has transformed how we track and respond to disruptions.”
- “AI-powered insights helped us predict incidents 2x faster.”
- “Automation reduced manual workload by 50%, improving team efficiency.”
Future Enhancements:
- Deeper AI-driven risk predictions using machine learning.
- Expanded third-party integrations for seamless data flow.
- More customization for user dashboards and reporting.
TAKEAWAY
Final Takeaways & Reflection
As the Principal Product Designer, I bridged business strategy and user needs to deliver the Unified Resiliency Platform, empowering enterprises to manage risks proactively. Key learnings:
- User research drives innovation: Insights shaped an intuitive, efficient product.
- Automation is key: Reduced manual work, boosting adoption and efficiency.
- Iteration improves usability: Real feedback refined workflows.
The platform is now a scalable, industry-leading solution, transforming enterprise resilience management.